
Unfortunately for some shareholders, the GrafTech International Ltd. (NYSE:EAF) share price has dived 43% in the last thirty days, prolonging recent pain. For any long-term shareholders, the last month ends a year to forget by locking in a 85% share price decline.
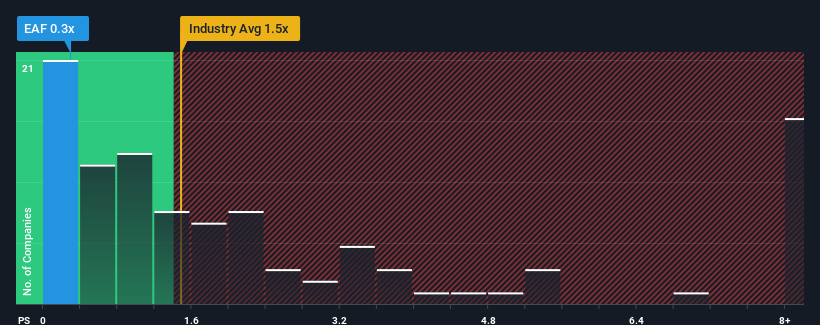
After such a large drop in price, GrafTech International's price-to-sales (or "P/S") ratio of 0.3x might make it look like a buy right now compared to the Electrical industry in the United States, where around half of the companies have P/S ratios above 1.5x and even P/S above 4x are quite common. However, the P/S might be low for a reason and it requires further investigation to determine if it's justified.
What Does GrafTech International's P/S Mean For Shareholders?
GrafTech International hasn't been tracking well recently as its declining revenue compares poorly to other companies, which have seen some growth in their revenues on average. It seems that many are expecting the poor revenue performance to persist, which has repressed the P/S ratio. If this is the case, then existing shareholders will probably struggle to get excited about the future direction of the share price.
Keen to find out how analysts think GrafTech International's future stacks up against the industry? In that case, our free report is a great place to start.How Is GrafTech International's Revenue Growth Trending?
GrafTech International's P/S ratio would be typical for a company that's only expected to deliver limited growth, and importantly, perform worse than the industry.
Retrospectively, the last year delivered a frustrating 35% decrease to the company's top line. This means it has also seen a slide in revenue over the longer-term as revenue is down 55% in total over the last three years. Therefore, it's fair to say the revenue growth recently has been undesirable for the company.
Turning to the outlook, the next year should generate growth of 1.3% as estimated by the five analysts watching the company. Meanwhile, the rest of the industry is forecast to expand by 13%, which is noticeably more attractive.
With this in consideration, its clear as to why GrafTech International's P/S is falling short industry peers. Apparently many shareholders weren't comfortable holding on while the company is potentially eyeing a less prosperous future.
What We Can Learn From GrafTech International's P/S?
GrafTech International's recently weak share price has pulled its P/S back below other Electrical companies. It's argued the price-to-sales ratio is an inferior measure of value within certain industries, but it can be a powerful business sentiment indicator.
As expected, our analysis of GrafTech International's analyst forecasts confirms that the company's underwhelming revenue outlook is a major contributor to its low P/S. At this stage investors feel the potential for an improvement in revenue isn't great enough to justify a higher P/S ratio. The company will need a change of fortune to justify the P/S rising higher in the future.
There are also other vital risk factors to consider and we've discovered 2 warning signs for GrafTech International (1 is significant!) that you should be aware of before investing here.
If strong companies turning a profit tickle your fancy, then you'll want to check out this free list of interesting companies that trade on a low P/E (but have proven they can grow earnings).
Have feedback on this article? Concerned about the content? Get in touch with us directly. Alternatively, email editorial-team (at) simplywallst.com.
This article by Simply Wall St is general in nature. We provide commentary based on historical data and analyst forecasts only using an unbiased methodology and our articles are not intended to be financial advice. It does not constitute a recommendation to buy or sell any stock, and does not take account of your objectives, or your financial situation. We aim to bring you long-term focused analysis driven by fundamental data. Note that our analysis may not factor in the latest price-sensitive company announcements or qualitative material. Simply Wall St has no position in any stocks mentioned.