
History has shown that after a rapid surge, panic index does not quickly return to calm.
After experiencing significant volatility on the US stock market last week, panic seems to have subsided, but if any guidance is provided by history, the market may remain tense in the coming months.
The Chicago Board Options Exchange Volatility Index (VIX) is the most watched panic index on Wall Street. After reaching its highest level in four years at the close of last week, the index quickly fell back, while the stock market also rebounded quickly after experiencing its most serious sell-off this year. The S&P 500 index (SPX) rose 3% from its low point last week, while the VIX lingered around 20, far below the closing price of 38.57 on August 5.
Investors have pointed out that signs of rapidly dissipating market anxiety further prove that last week's crash was due to the liquidation of large-scale leveraged positions, including arbitrage trading financed in yen, rather than long-term concerns about global growth.
Nevertheless, the turbulent period of VIX soaring after the crash indicates that the market often remains inflated in the months following a crash, which negates the kind of risky behavior that pushed up asset prices in the first half of the year.
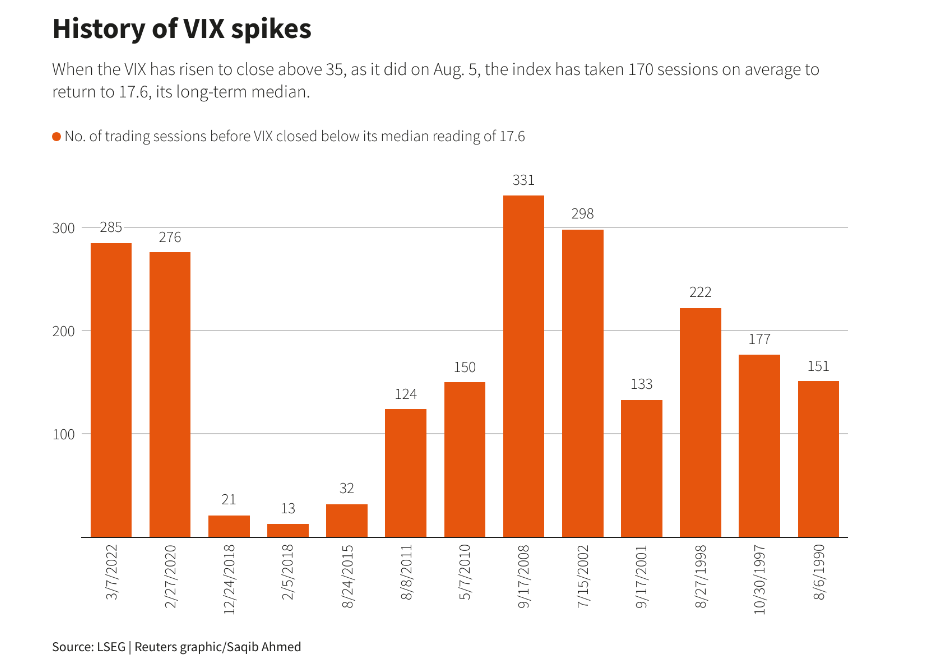
In fact, Reuters analysis shows that the VIX typically takes 170 trading days to return to its long-term median of 17.6. Closing above 35 is related to a high level of investor anxiety.
"Once the VIX stabilizes within a certain range, people will become more passive again," said JJ Kinahan, CEO of IG North America and President of online broker Tastytrade. "But it usually makes people uneasy for six to nine months."
Before the turmoil in the US stock market this month, the S&P 500 index went through a long and calm period, rising as much as 19% this year and setting a historical high in early July. Last month, disappointing performance from several tech giants with high valuations triggered widespread selling and pushed the volatility index slightly above the 10 range.
More severe turmoil occurred at the end of July and the beginning of August. The Bank of Japan unexpectedly raised interest rates by 25 basis points, squeezing investors who borrowed yen cheaply to buy high-yield assets such as US tech stocks and bitcoin.
At the same time, investors were eager to price in a series of worrying economic data that indicated a slowdown in the US economy. The S&P 500 index fell as much as 8.5% from its record high in July, with the 10% threshold, which is typically considered a correction, just one step away. The index still rose 12% this year.
Mandy Xu, head of global market derivatives intelligence at the Chicago Board Options Exchange, said the quick drop and quick rebound of the market indicated a risk exposure rundown driven by positions.
"What we saw on Monday (August 5) last week was only limited to the stock market and forex market. We didn't see any other asset classes, such as volatility in interest rates and credit," said JJ Kinahan, CEO of IG North America and President of online broker Tastytrade.
Investors have good reasons to remain nervous in the coming months. Many are waiting for more US economic data, including this week's Consumer Price Index (CPI) report.
Uncertainty ranging from the US presidential election in November to tensions in the Middle East also keeps investors on edge.
Nicholas Colas, co-founder of DataTrek Research, is watching whether the VIX can remain below its long-term average of 19.5 to determine whether the market has truly calmed down.
"Before VIX falls below the long-term average of 19.5 (for at least a few days), we need to respect market uncertainty and humbly try to find the bottom in the market or individual stocks," he said.
The S&P 500 index approaching the correction range may be another worry. Data since 1929 shows that in 28 instances where the S&P 500 index did not confirm a rebound of less than 1.5%, the index confirmed the rebound an average of 26 trading days later. In eight instances where rebound was not confirmed, the index took an average of 61 trading days to reach a new high.
Mark Haefele, chief investment research officer at Nationwide, said in a recent memo that CPI data due out on August 14 and earnings from Walmart and other retailers this week may be critical to determining investor sentiment.
"Given the recent emotional responses of the market, this week's CPI data, retail earnings and retail sales data could trigger investors' over-reaction, which is not surprising."
Editor/Emily