
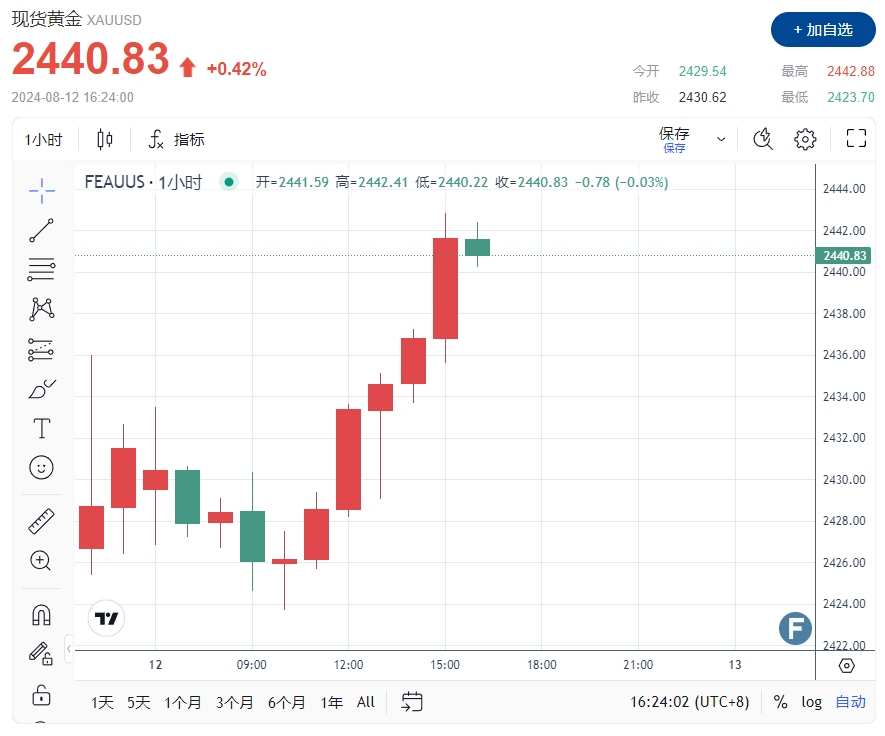
During the Asian market's closing on Monday (August 12), gold rebounded in the short term, reaching $2442. Meanwhile, Bitcoin fell deeply below the $58000 mark, hitting a low of $57651.
Investors are cautious and waiting for key US inflation data before making major bets on gold. The US Producer Price Index (PPI) will be released on Tuesday, followed by the Consumer Price Index (CPI) on Wednesday. In addition, US retail sales data to be released on Thursday will affect expectations for the direction of Federal Reserve policy, impact demand for the US dollar, and potentially push gold prices. Developments in geopolitical tensions will also affect short-term trends in gold.
However, despite market expectations that the Federal Reserve will lower interest rates by 25 basis points in September, and some are considering a 50 basis point cut, the US dollar remains on the rise. However, with expectations of a rate cut and high risk appetite in the stock market, the rise in the US dollar may only be temporary.
Normally, positive stock market sentiment would challenge safe-haven assets, but several factors continue to support the US dollar and limit downside risk. Federal Reserve Governor Michelle Bowman stated on Sunday that the Fed may not be ready to lower interest rates in September, citing inflation risks and a strong labor market. However, this has not led to a significant amount of US dollar buying or had a significant impact on gold prices.
Looking ahead in the short term, gold is expected to maintain its upward momentum, with resistance at $2,429 and potential resistance at $2,453. The release of key US inflation data this week may trigger significant market volatility, and caution is advised as breaking below $2,429 may increase selling pressure.
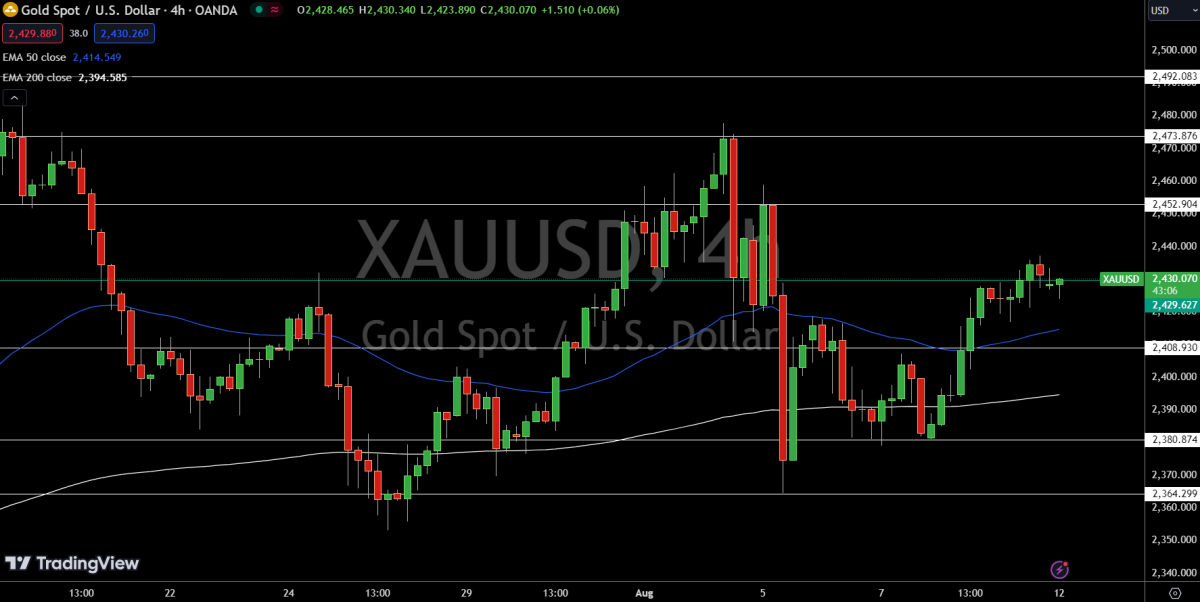
FXEmpire analyst Arslan Ali stated that the 4-hour chart for gold shows a support point at $2,429.62, which is a key level to maintain the bullish trend.
Gold Technical Analysis
Current resistance is at $2,452.90, followed by $2,473.87 and $2,492.08. On the downside, support is at $2,408.93, with further support at $2,380.87 and $2,364.29.
The 50-day exponential moving average (EMA) is $2,414.54, while the 200-day EMA is $2,394.58. Both provide solid support, and breaking below the pivot point at $2,429 may trigger a more severe sell-off trend.
Gold remains bullish above $2,429, but breaking below this level may accelerate selling pressure. #GoldTechnicalAnalysis#
FXEmpire analyst Bob Mason stated that Bitcoin is below the 50-day and 200-day EMA, signaling a bearish price.
(Source: FXEmpire)
Bitcoin Technical Analysis
Breaking above the $60,365 resistance level may support Bitcoin's rise to resistance at $60,365. Breaking through the $60,365 resistance level may drive the 50-day EMA into effect.
On the other hand, breaking below $55,000 may indicate a support level at $52,884.
The 14-day RSI reading is 42.76, and Bitcoin may fall to around $55,000 before entering oversold territory.
The 14-day RSI reading is 42.76. Bitcoin may fall to around 55,000 USD and then enter the oversold zone.

(Source: FXEmpire)