

Source: SWHY Macro.
Author: Wang Maoyu, Zhao Wei.
The US non-farm data is significantly weaker than expected, and the unemployment rate has continued to rise to 4.3%, triggering the recession signal of the 'Sahm rule' for the first time, causing a significant market shock. This report believes that the signal noise in August is large and there is a possibility of discontinuity. The key lies in whether there are exogenous shocks that may occur later.
Author: Wang Maoyu Zhao Wei
Please use your Futubull account to access the feature.
Hot topic thinking: Disproving the 'recession trade'?
(1) Sahm Rule: recession signal or distortion, pay attention to sustainability
In early August, the US July unemployment rate rose to 4.3%, triggering the recession signal of the 'Sahm rule' for the first time. The meaning of the Sahm rule is: when the three-month moving average of the unemployment rate (U3) rises 0.5 percentage points or more relative to the low point of the previous 12 months, it marks the beginning of an economic recession. The reading in July 2024 was 0.53, the first time since mid-2020. Experience-wise, the Sahm rule is highly successful in confirming the start of a recession. Since 1960, the Sahm rule has triggered 11 recession signals (excluding July 2024), 9 confirmed recessions, and 2 invalidations, with a success rate of 82%. Among them, the two invalidations (December 1959 and October 1969) were actually interruptions in signal occurrence. If they are counted as 1 signal that reappeared later, then the Sahm rule's success rate in confirming recessions can be considered as high as 100%.
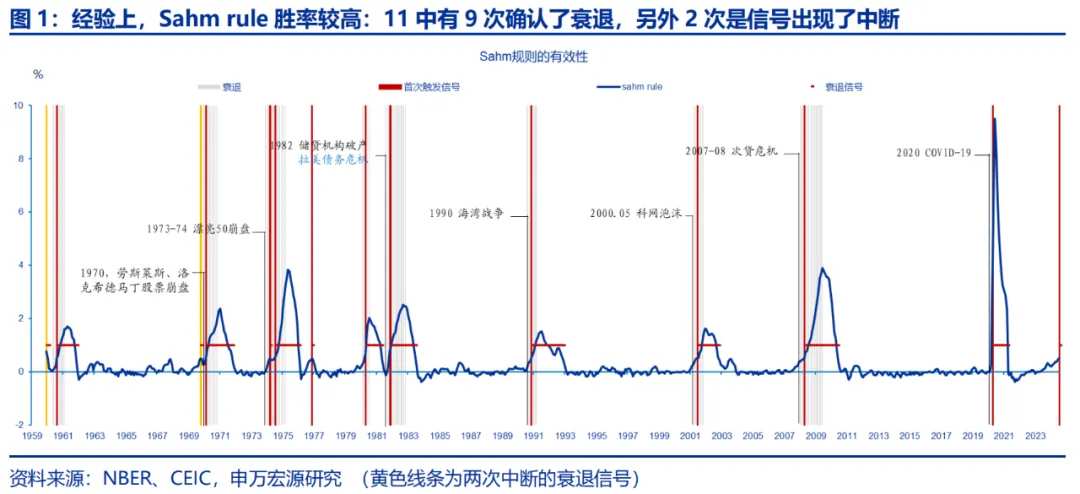
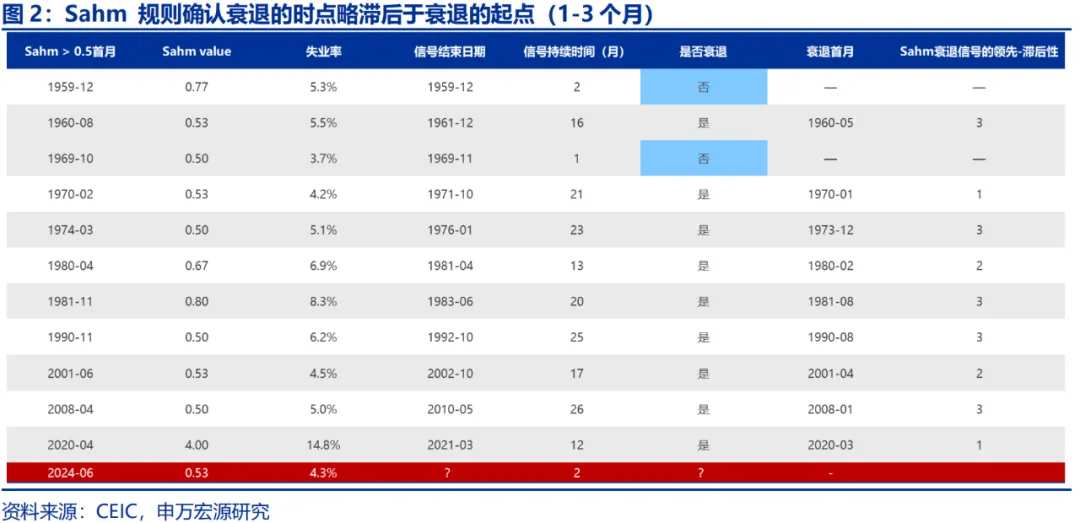
Different from leading and predictive rules, the Sahm rule is a signal confirming a recession, and it is experience-wise lagging (1-3 months). Early signals are mostly weak (slightly exceeding 0.5%), and the authenticity of signals can be identified from continuity or intensity. However, even if the signal appears to be interrupted, there is no reason to be complacent, the key is whether there are exogenous shocks.
 Any empirical rule implies probability, and each empirical rule requires economic explanation. Cyclical research often faces small sample problems. Therefore, the probability of the high-success empirical rules failing cannot be underestimated, especially this time: supply shocks and their repairs are the main narratives. We believe that the three key points behind the high success rate of the Sahm rule are: 1) no shock, no recession; 2) the need to distinguish between supply-side and demand-side, and the authenticity of the signal triggered by the unemployment rate increase dominated by the demand-side contraction is higher; 3) comparing the continuity and strength of the signal.
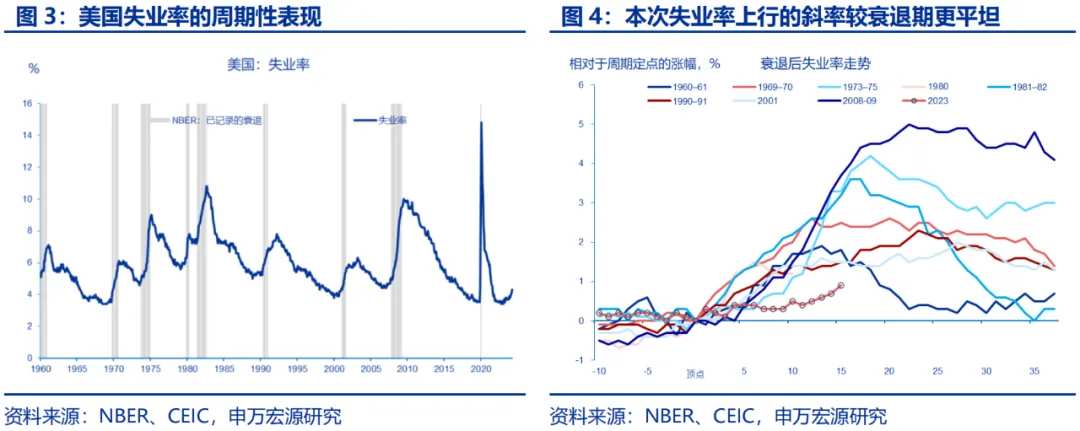
Since the beginning of this year, the rise in the US unemployment rate and the breakthrough of 4% are in line with expectations, but it is still in the 'mean reversion' stage, which is a manifestation of the labor market approaching the end of balancing, and the supply side is the main explanation. In addition, the increase in the unemployment rate to 4.3% in July was partly affected by temporary factors such as typhoons.
In this round of recovery cycle, the bottom of the US unemployment rate appeared in April 2023 (3.4%), and it remained below 4% until April 2024. It rose above 4% for the first time in May, and continued to rise to 4.1% and 4.3% in June and July, respectively, showing an accelerating trend in the short term. The Fed estimates the natural unemployment rate to be 4.2%.
Therefore, the US labor market has basically achieved a balance process. The mean reversion path of the unemployment rate in the past year has significant differences from the recession path in history. However, looking back on history cannot predict the future path.
In the first half of the year, the reason why we believed that the US unemployment rate was still on an upward trend was based on a basic common sense: the supply-side narrative of rising labor force participation and immigration inflows helps to bridge the supply-demand gap during the tight labor market stage, but it will create a surplus after the labor market reaches a basic balance, which is ultimately reflected in the upward trend of the unemployment rate.
In this round of Fed interest rate hike cycle, it is precisely because the supply-side repairs dominate the balancing of the labor market that the Fed can take care of the growth and inflation targets and make traditional effective empirical rules to be falsified (at least for now).
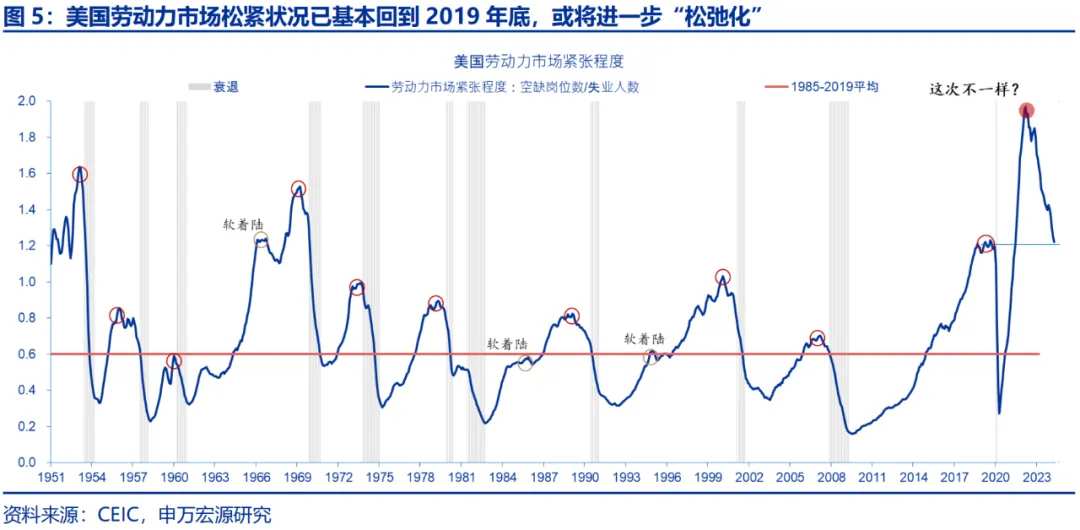
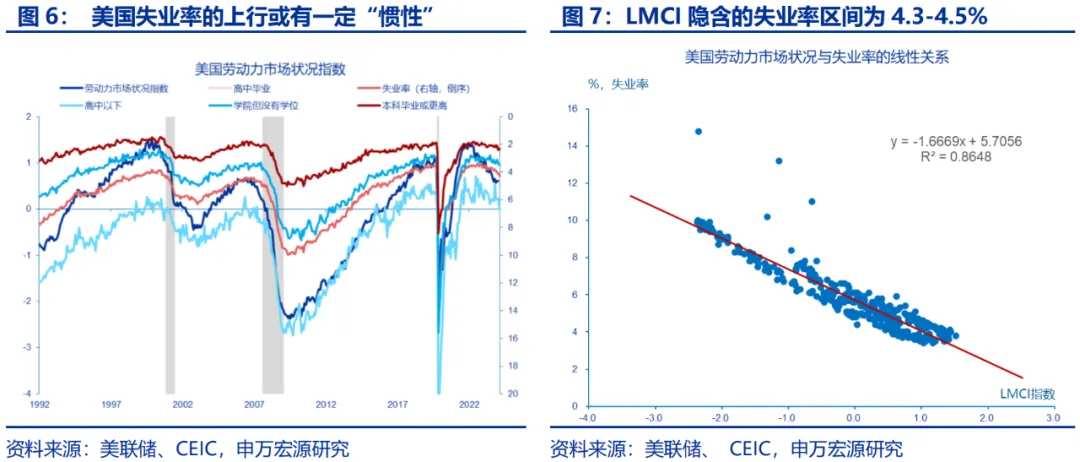
Looking ahead, in the short term, the balance of the US labor market may have a certain inertia, but in the absence of exogenous shocks, the probability of the recession-style rising of the unemployment rate is not high. The labor market conditions index (LMCI) implies a range of unemployment rates of 4.3-4.5%. Considering the noise in the July data and the inertia of balancing, we believe that the fluctuation range of the unemployment rate is 4.1%-4.5% (with a median of 4.3%).
(2) NBER recession standard: How to identify the start of a recession in real time?
For most research on US economic cycles and asset allocation based on a cyclical framework, they refer to the cycle peak and trough defined by NBER (National Bureau of Economic Research), and the expansion (the month after the trough to the peak) and recession stages (the month after the peak to the trough) determined by them.
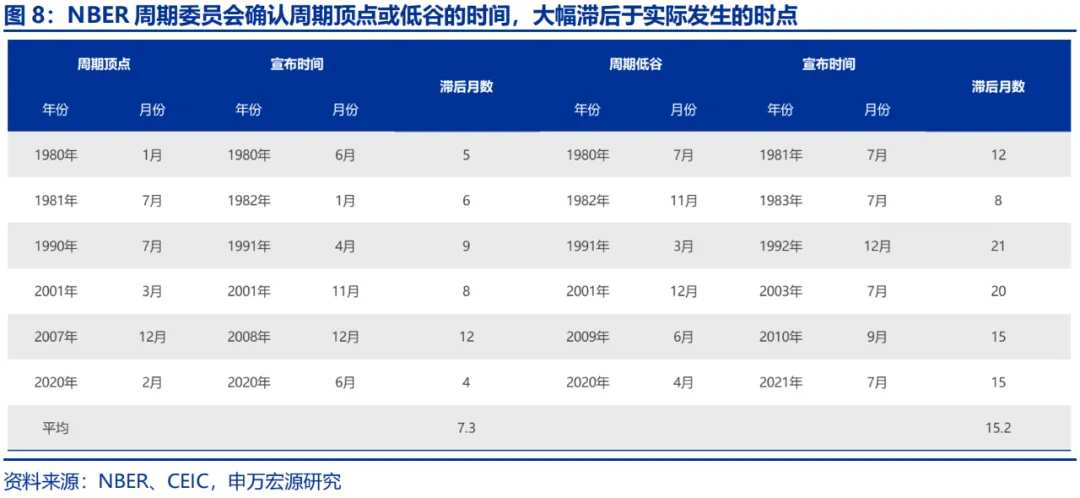
The practical problem is that the time when the NBER period committee confirms the peak or trough is significantly lagged behind the actual occurrence time. On average since 1980, the time to confirm the cycle peak is lagged behind by 7.3 months, and the time to confirm the cycle trough is lagged behind by 15.2 months. Therefore, how to track the cyclical operation status in real time and identify the inflection point of the cycle is the difficult point of asset allocation.
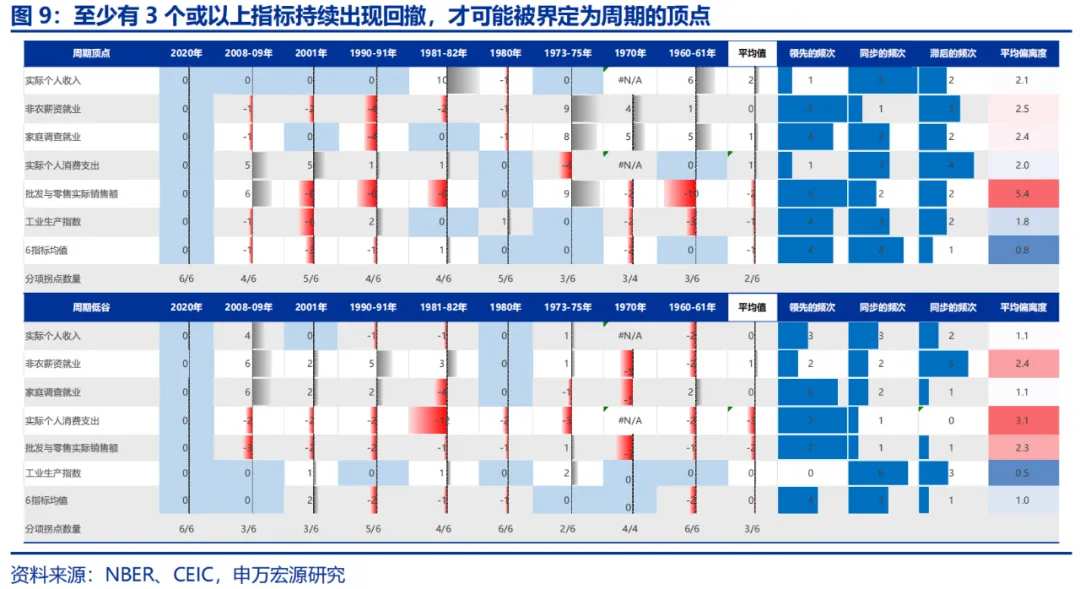
Based on research on 9 recession cases since 1960, we propose that 3 or more indicators in the 6 underlying indicators of NBER—real personal income, non-farm payroll (business survey), household survey employment (household survey), real personal spending, wholesale and retail actual sales and industrial production index—showing a pullback is a necessary condition for a cycle peak. And only after continued declines for a period of time, can it be determined as a recession—A shortcut is to cross-verify with quarterly GDP and GDI (gross domestic income) indicators: If GDP or GDI has negative growth for two consecutive quarters (or twice in three quarters), the probability of being confirmed as a recession will increase, otherwise it is probably a "fake recession".
As of the end of July, only one index is continuously and increasingly pulling back (compared to the highest value in the past 75 months): actual sales of wholesale and retail (-7.4%). The pullback of the industrial production index is limited, with the maximum pullback of -2.1% (June 2022), which significantly recovered in the first half of this year and has now converged to -0.1%. Since October 2023, the household survey employment has also begun to decline, but the pullback as of July was only -0.3% (the maximum pullback in February 2024 was -0.6%). In addition, actual personal consumption expenditure, actual personal income, and non-farm payroll employment are still hitting new highs.
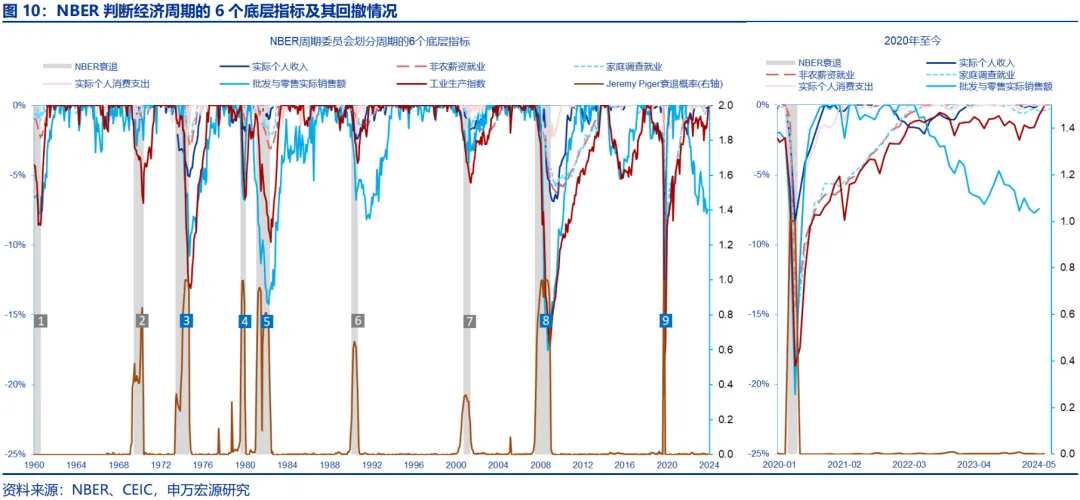
In fact, this structural differentiation feature has persisted since the end of 2022, that is, the industrial production index and wholesale and retail actual sales are weak, but the other four indicators have always been resilient. In fact, industrial production and wholesale and retail correspond to the inventory cycle, which are more significantly affected by the impact of the Fed's interest rate hike and the external cycle; the other four indicators are closely related to labor market conditions: new employment and wage growth determine personal income, and then determine Consumption. Ultimately, regarding the question of whether the US economy will decline, labor market still plays a decisive role. The most critical indicator is still the unemployment rate. As mentioned earlier, until an exogenous shock occurs, the unemployment rate will show a pattern of fluctuating around 4.3% in the short term.
(III) The "Triple Signals" of a Recession: Early Warning, Turning Point, and Confirmation.
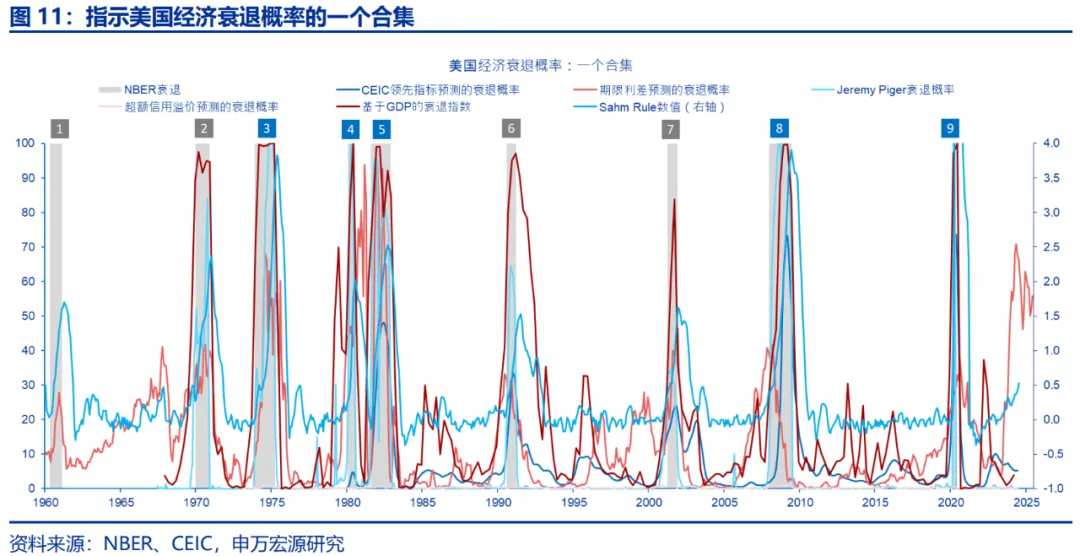
Sahm's rule is a lagging indicator for confirming a recession, and should be cross-verified with other leading and synchronous indicators. The current pattern is,
1) The probability of a recession indicated by leading indicators tends to decline. For example, the probability of a recession indicated by the CEIC comprehensive leading index has not increased, the probability of a recession within the next 12 months indicated by the term premium has decreased, and the recession law indicated by the excess credit spread is at a low point (marginally decreasing);
2) Synchronous indicators have not yet indicated the risk of a recession, as Jeremy Piger's recession probability and the recession index based on GDP have not increased;
3) Lagging indicators represented by Sahm's rule show an upward trend of recession risk. However, as mentioned earlier, there is a certain amount of noise in the readings, and further observation is still needed.
Assuming no exogenous shock, the benchmark assumption for the US economy is still a "soft landing." In the second quarter, the US GDP annualized growth rate was 2.8%, far exceeding the market's long-held expectation (2.0%). Structurally, private consumption, manufacturing investment, and imports all show that domestic demand is resilient.
Logically speaking, the orderly operation of the labor market guarantees the growth rate of residents' income. The downward trend in bulk commodity prices helps to boost real income growth and consumer confidence. Private consumption can still act as a "stabilizer"; the loose financial conditions, the enhanced willingness of bank credit and the expected interest rate cut by the Fed can provide a certain support for real estate and manufacturing investment, and the direction of the cycle is from the bottom up.
However, considering that the federal funds rate, mortgage loans, consumer loans, and other interest rates will remain at relatively high levels for a period of time, as well as the US election and Trump's trade policy proposals and local risks in the credit card and commercial real estate fields, we believe that the risk of further downward revision of the US economy may dominate.
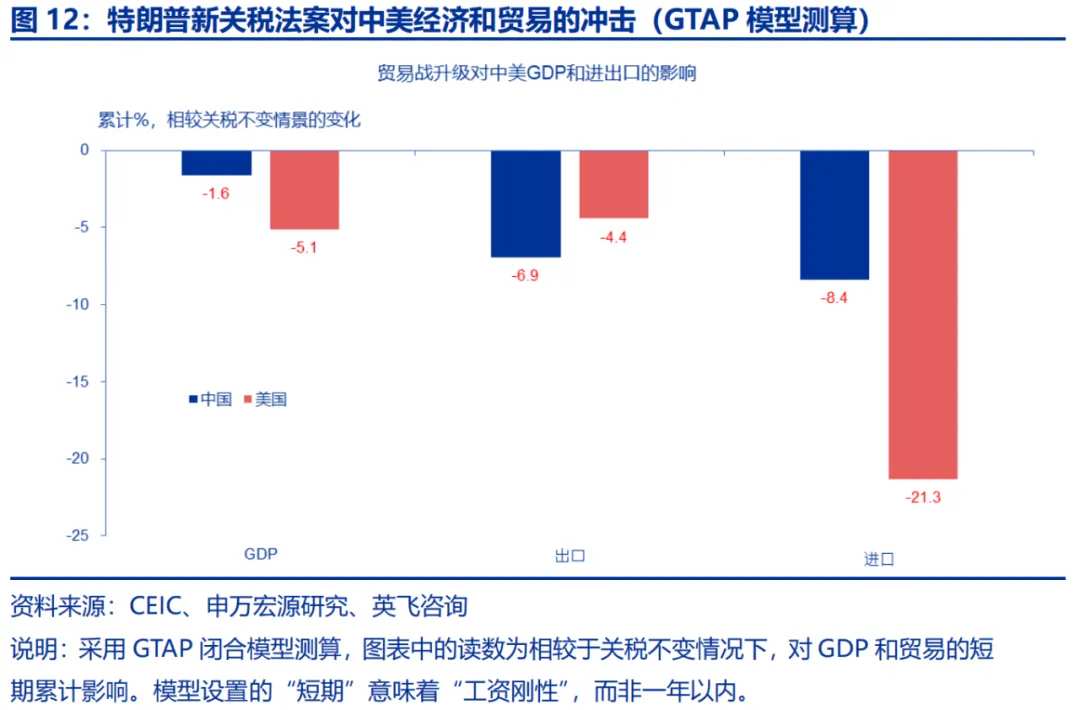
Based on the results of the global trade general equilibrium model (GTAP) simulated by our research team and the INSEE Consulting team, under a pessimistic scenario, if Trump is re-elected and cancels China's most favored nation treatment, imposes a 60% tariff on China (after stacking the 301 tariff) and a 10% tariff on other economies, this will drag China's real GDP, exports and imports by 1.6, 6.9, and 8.4 percentage points, respectively. However, the drag on US GDP, imports, and exports is even greater than that of China, and the corresponding readings are -5.1, -4.4, and -21.3 percentage points, respectively. Considering that the US economy is currently in a late-cycle stage, the escalation of trade conflicts may increase the probability of a recession in the US economy.
Editor/Somer
