
N-able (NYSE:NABL) has had a rough month with its share price down 11%. But if you pay close attention, you might find that its key financial indicators look quite decent, which could mean that the stock could potentially rise in the long-term given how markets usually reward more resilient long-term fundamentals. Specifically, we decided to study N-able's ROE in this article.
Return on Equity or ROE is a test of how effectively a company is growing its value and managing investors' money. In simpler terms, it measures the profitability of a company in relation to shareholder's equity.
How Is ROE Calculated?
The formula for return on equity is:
 Return on Equity = Net Profit (from continuing operations) ÷ Shareholders' Equity
So, based on the above formula, the ROE for N-able is:
4.5% = US$32m ÷ US$724m (Based on the trailing twelve months to June 2024).
The 'return' is the yearly profit. One way to conceptualize this is that for each $1 of shareholders' capital it has, the company made $0.04 in profit.
What Has ROE Got To Do With Earnings Growth?
So far, we've learned that ROE is a measure of a company's profitability. We now need to evaluate how much profit the company reinvests or "retains" for future growth which then gives us an idea about the growth potential of the company. Generally speaking, other things being equal, firms with a high return on equity and profit retention, have a higher growth rate than firms that don't share these attributes.
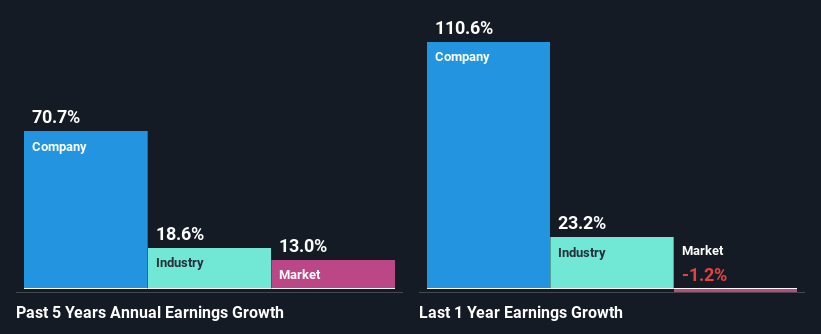
A Side By Side comparison of N-able's Earnings Growth And 4.5% ROE
It is quite clear that N-able's ROE is rather low. Even when compared to the industry average of 13%, the ROE figure is pretty disappointing. However, we we're pleasantly surprised to see that N-able grew its net income at a significant rate of 71% in the last five years. We reckon that there could be other factors at play here. For instance, the company has a low payout ratio or is being managed efficiently.
We then compared N-able's net income growth with the industry and we're pleased to see that the company's growth figure is higher when compared with the industry which has a growth rate of 19% in the same 5-year period.
The basis for attaching value to a company is, to a great extent, tied to its earnings growth. It's important for an investor to know whether the market has priced in the company's expected earnings growth (or decline). By doing so, they will have an idea if the stock is headed into clear blue waters or if swampy waters await. One good indicator of expected earnings growth is the P/E ratio which determines the price the market is willing to pay for a stock based on its earnings prospects. So, you may want to check if N-able is trading on a high P/E or a low P/E, relative to its industry.
Is N-able Efficiently Re-investing Its Profits?
Given that N-able doesn't pay any regular dividends to its shareholders, we infer that the company has been reinvesting all of its profits to grow its business.
Summary
In total, it does look like N-able has some positive aspects to its business. Despite its low rate of return, the fact that the company reinvests a very high portion of its profits into its business, no doubt contributed to its high earnings growth. With that said, the latest industry analyst forecasts reveal that the company's earnings growth is expected to slow down. To know more about the company's future earnings growth forecasts take a look at this free report on analyst forecasts for the company to find out more.
Have feedback on this article? Concerned about the content? Get in touch with us directly. Alternatively, email editorial-team (at) simplywallst.com.
This article by Simply Wall St is general in nature. We provide commentary based on historical data and analyst forecasts only using an unbiased methodology and our articles are not intended to be financial advice. It does not constitute a recommendation to buy or sell any stock, and does not take account of your objectives, or your financial situation. We aim to bring you long-term focused analysis driven by fundamental data. Note that our analysis may not factor in the latest price-sensitive company announcements or qualitative material. Simply Wall St has no position in any stocks mentioned.