
Table of Contents.
What is an economic recession? It is a comprehensive and deep recession in economic activity. The current economy is closer to a slowdown than a recession.
Common indicators for predicting a recession: Some models have already been triggered, but the "speciality" of this economic cycle has made many indicators invalid. In order to predict a recession and guide trading, the market often uses GDP growth rate, US bond term spread, Sahm rule, and Bank of Japan's rate hikes as forward-looking indicators of economic recession. Some indicators have already been triggered, but these indicators also have certain limitations and cannot be simply applied. The "speciality" of this round of the US economic cycle (the obvious staggered mismatch in every link forms a hedge) has made some indicators clearly invalid, such as negative GDP growth, inverted curve, etc., but the recession has not yet arrived, fully illustrating this round of cycle. The "speciality" ("Why hasn't the US economy" recession" come yet?).
Main factors causing recession: monetary contraction, fiscal austerity, high leverage, stock market crash, external shocks; most pressures are controllable.
Experience in recession: Investment noticeably declines, if the degree of recession is deeper, risk assets continue to be under pressure, and repair gradually occurred after late recession.
Lessons for today: Under the pressure of economic slowdown, after the safe-haven assets have realized interest rate cuts, the call to action has been basically ended. After the risk assets have declined, there may be better opportunities to buy in.
US economic data has repeatedly been below expectations, combined with the reversal of carry trades and the significant volatility of global equity markets, which has significantly increased market concerns about the US economic recession and "hard landing". In this article, we clarify the concept, characteristics, and triggering factors of a recession and determine the potential recession risk of this round. Thus, we can answer core questions that investors are focused on: How to make trades next, whether to focus on buying opportunities if the market falls or the risk of further declines?
Main text
The July non-farm employment and ISM manufacturing PMI data were both significantly lower than expected, which has significantly increased market concerns about the US economic recession and "hard landing". After the release of the non-farm data on Friday, US Treasury yields quickly fell below 3.8%, US stocks significantly fell, the S&P index hit a two-year high for single-day decline, and the US dollar index fell to 103, all of which meet the characteristics of a "recession trade". However, there are interesting "exceptions". In the midst of a recession narrative, copper instead rose slightly by 0.4%. Gold rebounded under the decline of real interest rates and the US dollar index, and is basically close to the range predicted by our model based on real interest rates and the US dollar.Outlook for the second half of 2024: The easing has already passed the halfway point.This also reflects the differences and entanglements of different assets in trading during a recession.
Obviously, the judgment of the degree of economic slowdown is critical, as it directly determines the choice of assets and operational strategies. In other words, is it just a normal slowdown or a deep recession? Is it a "soft landing" or a "hard landing"? A slowdown is an indisputable fact and is the result of the current US economic cycle and financial conditions tightening; otherwise, the Federal Reserve would have no reason to cut interest rates. However, if it is just a normal economic slowdown, that is, if the degree is not deep and the Federal Reserve can use slight interest rate cuts to return monetary policy to neutrality and easing to boost demand (such as in 1995 and 2019), for risk assets, it will not be under systemic pressure but may face short-term pressure but gradually turn into the denominator improvement logic, which means that the decline provides better opportunities to buy. (Ref. 11)Is the US stock market trading during a recession now?If it is a recession risk, it means that the decline in demand is very deep, and the Federal Reserve also needs to cut interest rates significantly to offset economic pressure, or even the rate cuts are not enough to boost demand. In this case, there will be more trade sub-logic decline rather than denominator improvement, i.e. risk assets cannot be touched in the short term. For example, the deep recession caused the largest decline in the US stock market by 44%, which is significantly larger than the mild slowdown of 19%.
Figure: The largest decline in the US stock market during a deep recession was 44%, which is significantly larger than the mild slowdown of 19%.
Of course, the "recession narrative" may also become the actual "recession trade" even when there is no significant pressure on economic growth, which reflects the amplification of emotions. Previously, the concern about inflation staying high exceeded expectations, and the current weak economy is also causing concerns about economic recession. These are all effects of the accumulation of gains and amplification of emotions. (Ref. 16)The weather is good today The weather is good today.In this article, we clarify the concept, characteristics, and triggering factors of a recession, determine the potential risk of this cycle's recession, and then answer investors' core question of what to do next: should they look for buying opportunities in the event of a drop, or focus on the risk of further decline?
In this article, we clarify the concept, characteristics, and triggering factors of a recession and determine the potential recession risk of this round. Thus, we can answer core questions that investors are focused on: How to make trades next, whether to focus on buying opportunities if the market falls or the risk of further declines?
What is an economic recession? It is a comprehensive and deep recession in economic activity. The current economy is closer to a slowdown than a recession.
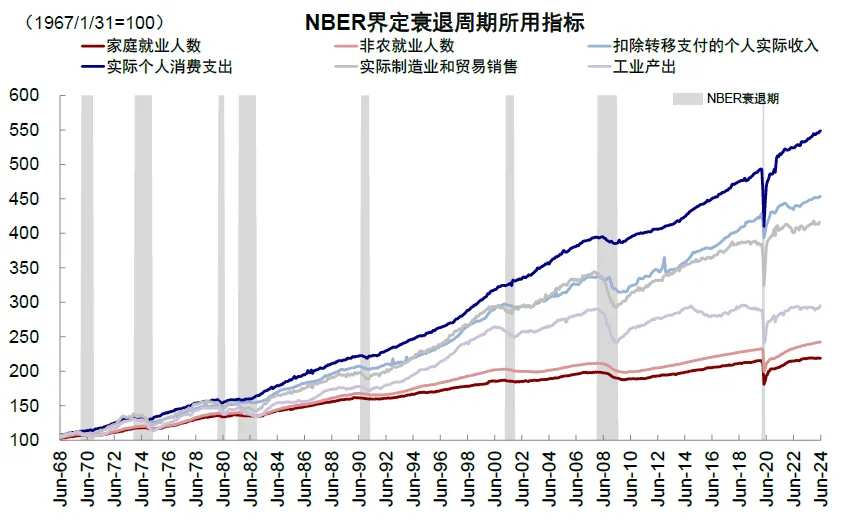
Economic recession refers to a serious, widespread, and long-term downturn in economic activity. The United States has long been recognized by the National Bureau of Economic Research (NBER) regarding the stage of recession. The main indicators considered include personal actual income after deducting transfer payments, non-agricultural employment, household survey employment, actual personal consumption expenditure, actual manufacturing and trade sales, and industrial output. When NBER determines a recession, it should consider the depth, diffusion, and duration. All three dimensions mentioned above should be met, but the extreme values of one standard may compensate for the shortcomings of other standards. NBER does not disclose specific quantitative standards, and announcement time is often delayed. Therefore, it is difficult to use judgment on the above dimensions as a specific reference for recessive trading in actual operations. Reviewing the historical experience of economic recession in the United States.Please use your Futubull account to access the feature.
Chart: The main indicators considered by NBER to define a recession include six indicators such as personal actual income after deducting transfer payments, and non-agricultural employment.
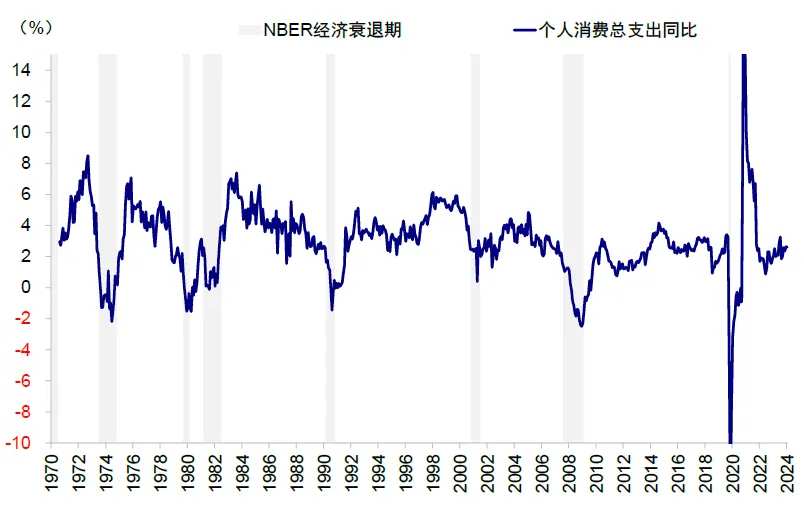
From the perspective of the current main indicators, the US economic fundamentals can only be regarded as slowing down, and there is still a distance from the recession defined by NBER. From the perspective of the dimension of NBER's adopted indicators, 1) income and consumption, personal disposable income has slightly slowed down year-on-year, from 4.0% at the beginning of the year to 3.6% in June, and personal consumption expenditure has risen from 1.9% at the beginning of the year to 2.6% in June. Since 2023, both have maintained relatively stable growth rates.
Chart: Personal consumption expenditure has risen from 1.9% at the beginning of the year to 2.6% in June, and since 2023, both have maintained relatively stable growth rates.
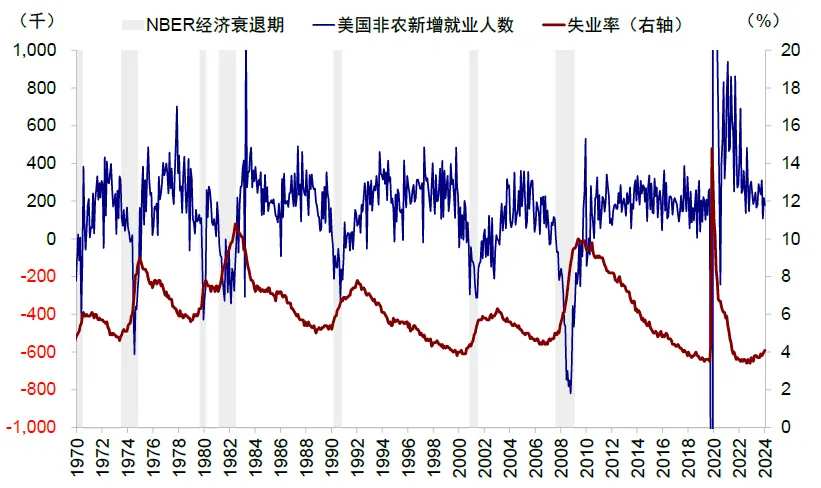
2) Employment, the overall employment market is indeed cooling down, especially the non-farm employment increased by 0.114 million people in July, which is much lower than expected. But it cannot be ruled out that it may be interfered by "accidental" and "temporary" factors. According to the Department of Labor report, it may contribute to two-thirds of the 0.2 percentage point increase in the unemployment rate.
Chart: The overall employment market is indeed cooling down, especially the non-farm employment increased by 0.114 million people in July, which is much lower than expected.
3) Production, both the monthly and year-on-year growth rates of industrial output have improved, and the year-on-year growth rate reached 1.6% in June this year.
Chart: Both the monthly and year-on-year growth rates of industrial output have improved, and the year-on-year growth rate reached 1.6% in June this year.
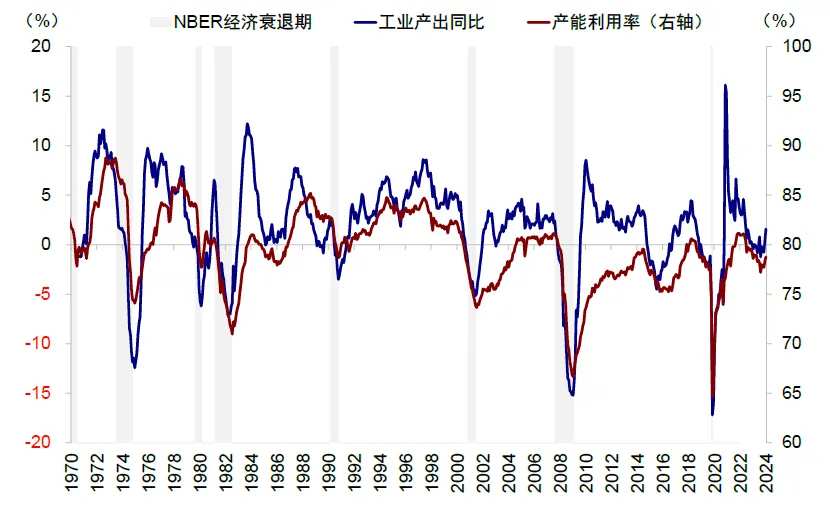
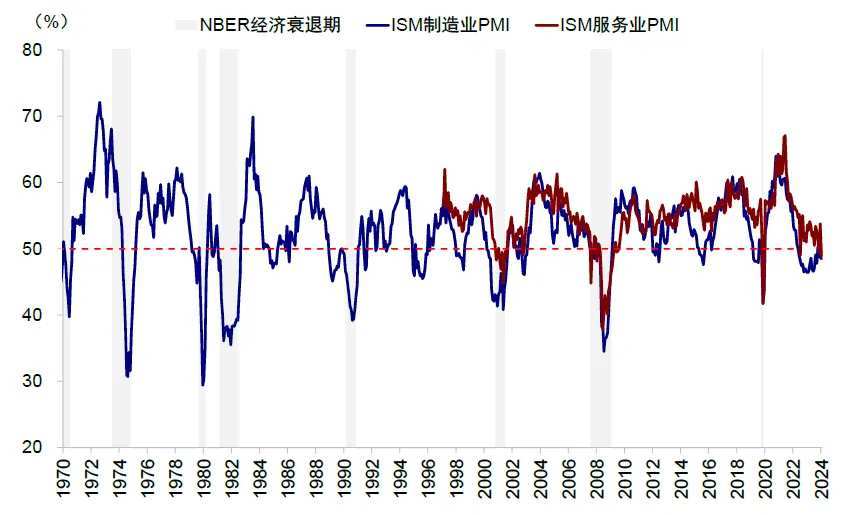
Chart: The PMI for the US ISM manufacturing sector dropped significantly in July and was lower than expected.
By comparing the indicators of various dimensions during the NBER recession since 1970: 1) Income and consumption, personal consumption expenditure slowed down significantly before the recession, and personal consumption expenditure turned negative in 6 rounds of recession; 2) Employment, the unemployment rate in the early stage of the recession rose on average to more than 5%, and the number of non-farm employment turned negative; 3) Production and investment, the year-on-year growth rate of industrial output quickly fell and turned negative, and the actual non-residential fixed investment scale fell by an average of about 8%.
Chart: An overview of the five-dimensional US economic synchronous indicators (Coincident Indicator).
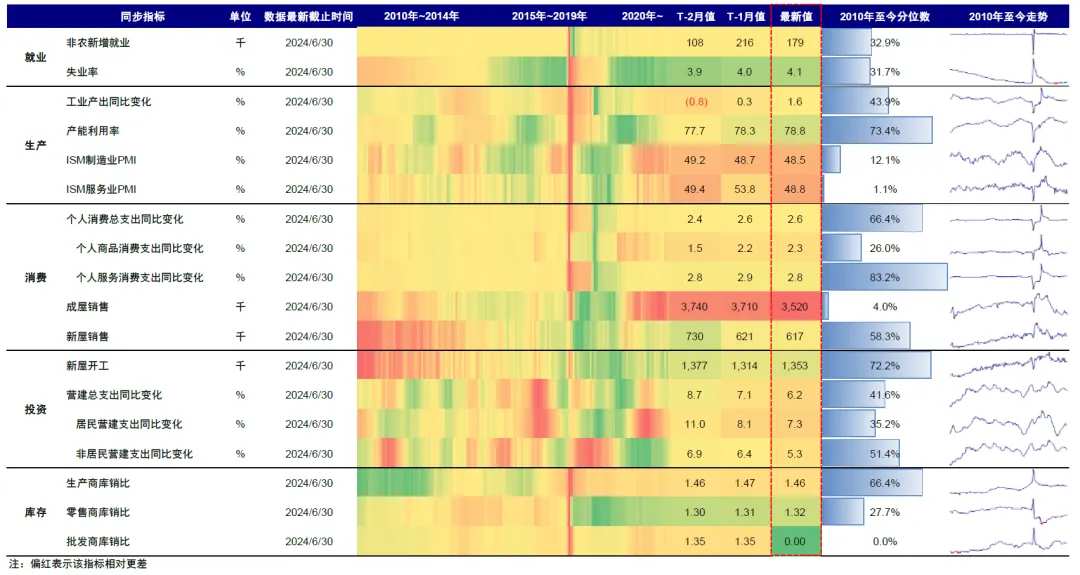
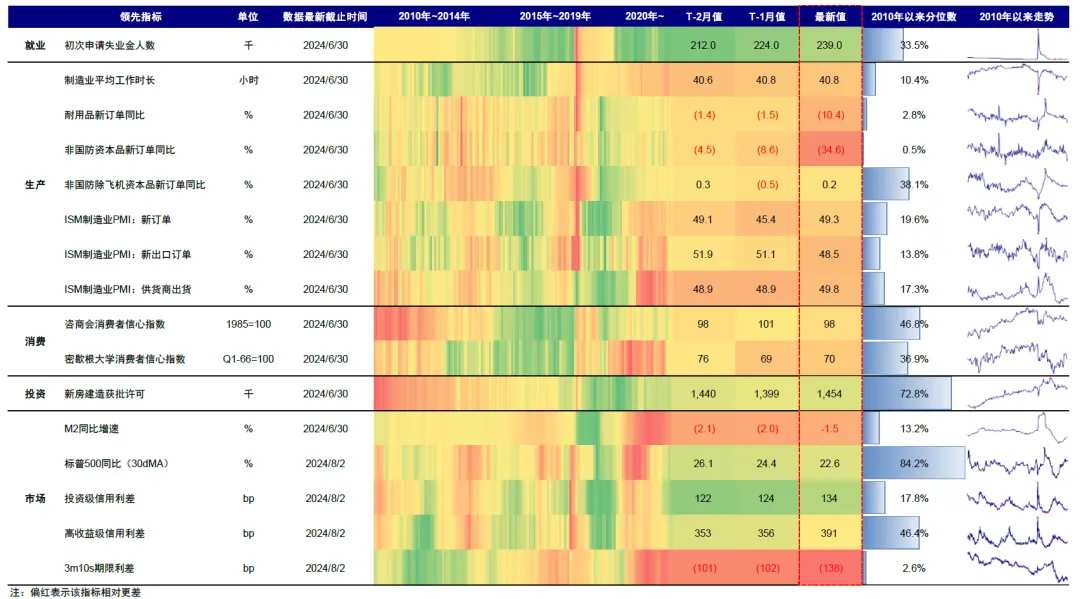
Chart: An overview of the five-dimensional US economic leading indicators (Leading Indicator).
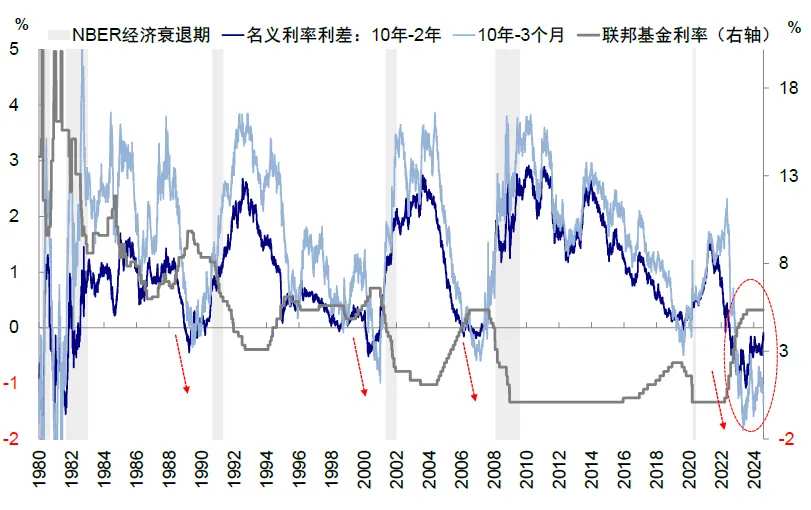
Common indicators for predicting a recession: Some models have already been triggered, but the "speciality" of this economic cycle has made many indicators invalid. In order to predict a recession and guide trading, the market often uses GDP growth rate, US bond term spread, Sahm rule, and Bank of Japan's rate hikes as forward-looking indicators of economic recession. Some indicators have already been triggered, but these indicators also have certain limitations and cannot be simply applied. The "speciality" of this round of the US economic cycle (the obvious staggered mismatch in every link forms a hedge) has made some indicators clearly invalid, such as negative GDP growth, inverted curve, etc., but the recession has not yet arrived, fully illustrating this round of cycle. The "speciality" ("Why hasn't the US economy" recession" come yet?).
Chart: The most common indicators for predicting a recession have certain limitations and cannot be simply applied.Why hasn't the US economy entered a recession yet?1) The model of two consecutive quarters of negative GDP growth as a "technical recession". The actual GDP growth in the first and second quarters of 2024 is still strong, which does not meet this definition. From the perspective of historical experience, "technical recession" usually means that the real recession defined by NBER will also occur, but the opposite is not true. Since 1948, a total of 12 recessions have been defined by NBER, and the total number of technical recessions with two consecutive quarters of negative GDP growth is 10. It can be seen that each technical recession corresponds to a recession defined by NBER, but the opposite is not necessarily true. The initial value of actual GDP in the second quarter of 2024 recorded a quarter-on-quarter annualized preliminary value of 2.8%, which was higher than the 1.4% in the first quarter and exceeded the market expectation of 2%, which does not meet the definition of "technical recession". Earlier, the consecutive two quarters of negative growth in the first half of 2023 caused concerns about recession, but it was later proved that this experience was not applicable.
Chart: The actual GDP growth in the first and second quarters of 2024 is still strong, which does not meet the definition of a technical recession.
Chart: Some models for predicting a recession have been triggered, but the "speciality" of this economic cycle has made many indicators invalid.

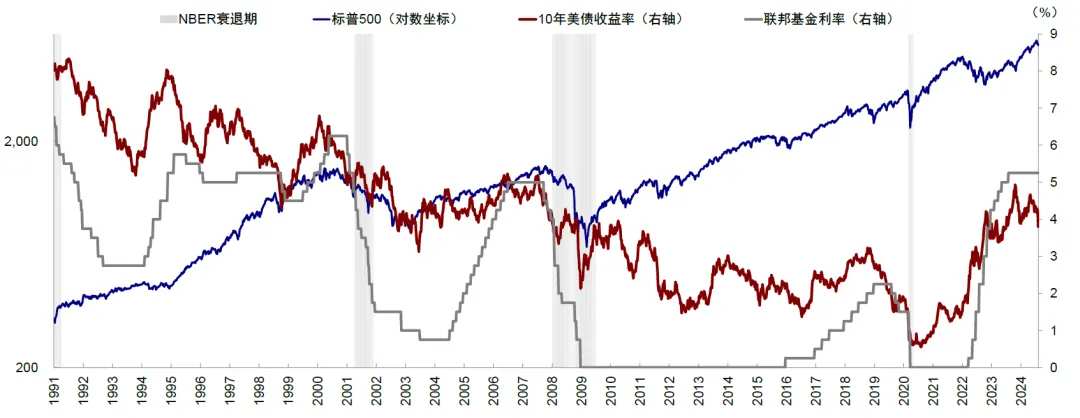
The inverted yield curve is not necessarily related to weakened demand and recession. The current inversion has lasted for nearly two years (the 2s10s spread turned negative on July 5, 2022, and the 3m10s spread turned negative on October 27, 2022). Private sector credit has not yet collapsed significantly. In terms of determining recession pressure, the 3m10s spread is the main reference for the New York Fed's recession prediction model and essentially measures the relationship between short-term financing costs and long-term return. However, since the Fed's significant 525 basis points rate hikes, the yield curve has remained inverted for nearly two years and is currently in its deepest inversion since the 1980s. Private sector investment has remained relatively resilient, even opening up a small credit expansion on the occasion of the loosening of financial conditions at the beginning of the year. ("1") Product structure, 10-30 billion yuan products operating income of 401/1288/60 million yuan respectively.The weather is good today The weather is good today.Please use your Futubull account to access the feature.
Chart: The inverted yield curve of US Treasuries has persisted for two years.
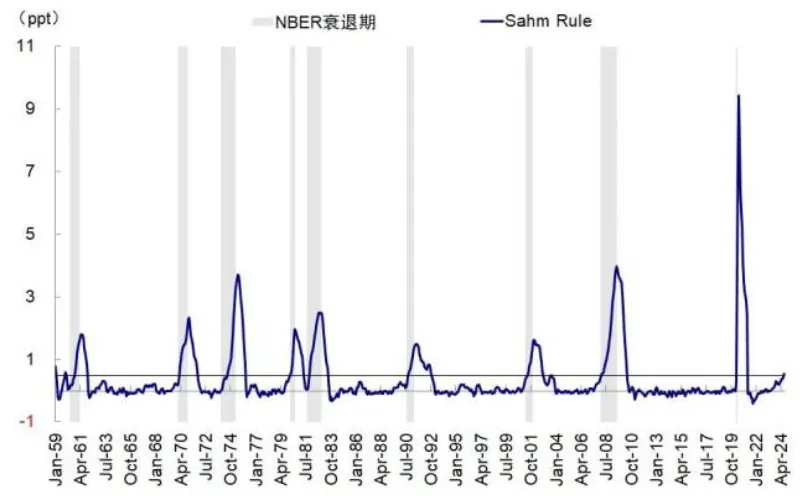
The Sahm rule shows that the rising unemployment rate has triggered a recession, but the rule may not be effective under the high-growth and low-inflation combination. When the three-month moving average of the unemployment rate rises 0.50 percentage points or more relative to the low point of the previous 12 months, it indicates that an economic recession is imminent. However, this index is not forward-looking, and often surpasses 0.5 after the recession has entered. Since 1960, the average value when entering a recession has been 0.26, but when this index reaches 0.5, it is definitely within the recession stage. After the release of July's unemployment rate data last Friday evening, the value of the Sahm rule has exceeded 0.5. For the Sahm rule, Sahm also has his own evaluation that when economic growth is good and inflation falls to 2%, it may not necessarily constitute a recession. In addition, in Sahm's latest interview, he also stated that he is not facing an immediate risk of recession, which may be different this time, such as immigration impact. It is necessary to consider the starting point of the rising unemployment rate rather than just the magnitude.[1]
Chart: The Sahm rule shows that the rising unemployment rate has triggered a recession.
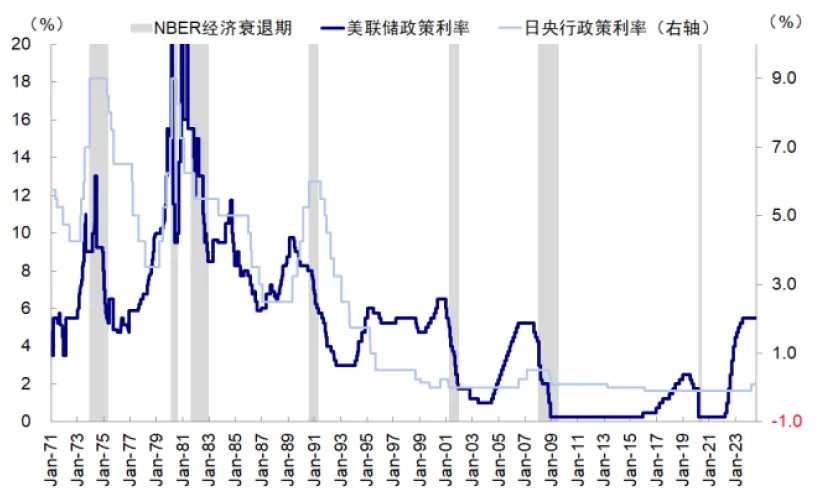
The BOJ raised interest rates again last week, which according to market experience is a prelude to a recession; however, this is a retrospective law and lacks necessary correlation. The four interest rate hike cycles of the BOJ, including this one, are all in the phase when the Fed rate hike is nearing its end. Therefore, judging the US economic recession by the BOJ's rate hike is actually judging that "Fed rate hikes often lead to recessions", but not all previous Fed rate hike cycles have always necessarily led to recessions.
Chart: The BOJ raised interest rates again last week, which according to market experience is a prelude to a recession.
It is not difficult to see that each index has its own limitations and even becomes ineffective, indicating that instead of being mechanically entangled in the rules summarized based on historical laws, we should understand the mechanisms behind them and whether they are applicable to this particular situation. The benchmark scenario at present is that the economy is moderately weakening, which is also the result of financial conditions tightening and interest rate cuts. Since the rate hike cycle, the tight financial conditions themselves have restrained growth and demand, but the restrictive effect of monetary policy and financial conditions on demand is marginal, so it is not suitable to excessively linearly extrapolate the degree of fundamental weakness. ("9")Global Market Outlook for Second Half of 2024: Easing Has Passed the Midpoint.Please use your Futubull account to access the feature.
Main factors causing recession: monetary contraction, fiscal austerity, high leverage, stock market crash, external shocks; most pressures are controllable.
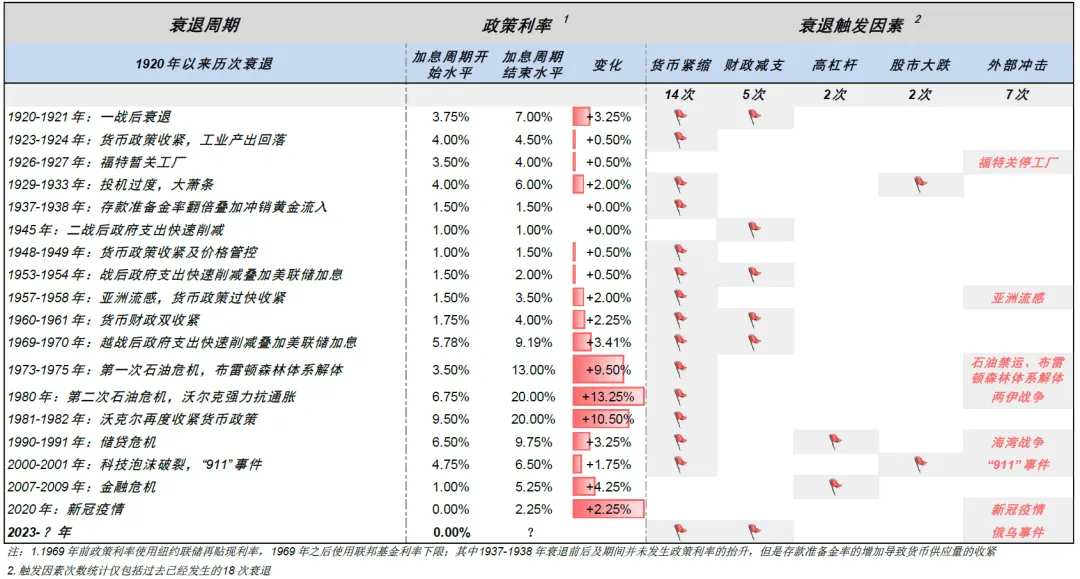
There have been 18 recessions in the United States since the 1920s. The triggering factors for a recession are multiple, and many times it is not caused by a single factor. After analyzing and summarizing them one by one, we found that the triggering factors can generally be attributed to one or more of the following situations: monetary contraction, fiscal austerity, high leverage, stock market crash, and external shocks. For example, in the 1970s and 1980s, it was more due to the Fed's rapid rate hikes to cope with high inflation caused by supply-side shocks; the 1929 Great Depression and the bursting of the 2000 dotcom bubble were more due to large-scale speculation and overvaluation pushing up US stocks and triggering systemic financial risks. In 1920, 1945, 1953, and 1969, it was more due to significant cuts in post-war government spending. To sum up, among the factors that have triggered 18 recessions, monetary contraction accounted for 14 times, fiscal austerity 5 times, high leverage twice, stock market crash twice, and external shocks 7 times.
Chart: According to the NBER definition, there have been 18 recessions in the United States since the 1920s.
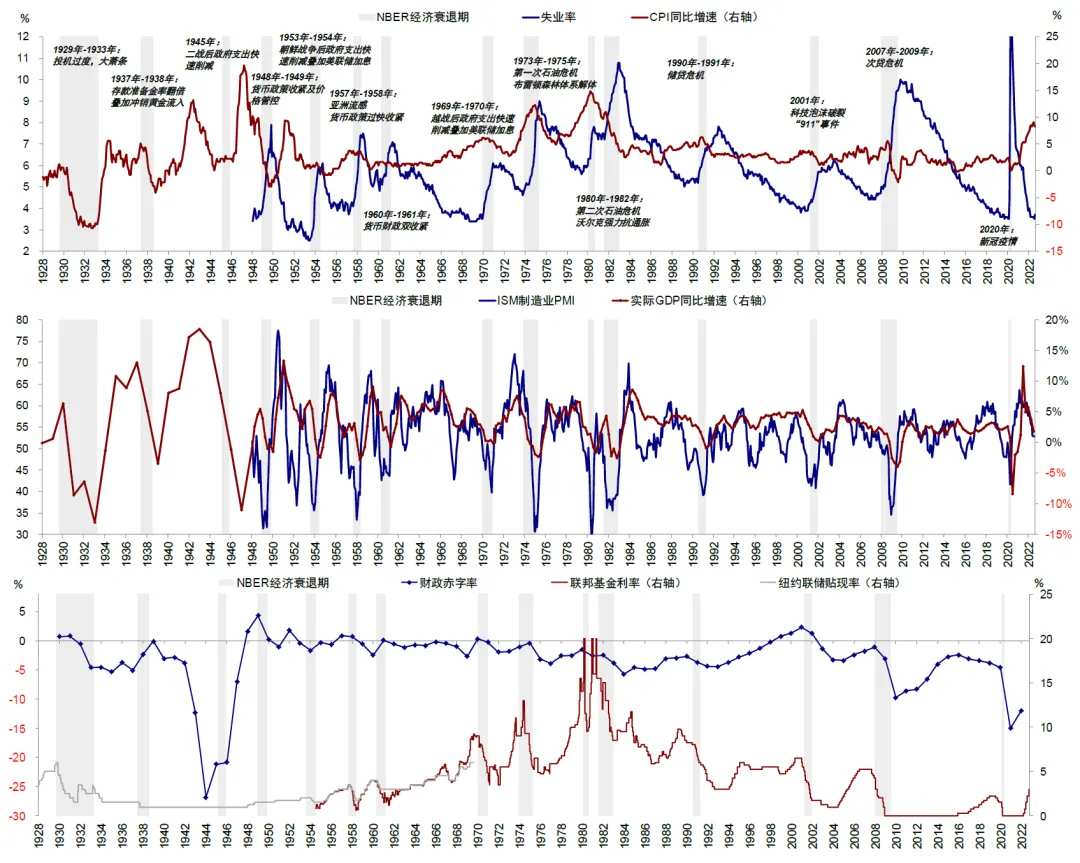
Chart: The triggering factors for the previous recessions include monetary contraction, fiscal austerity, high leverage, stock market crash, and external shocks.
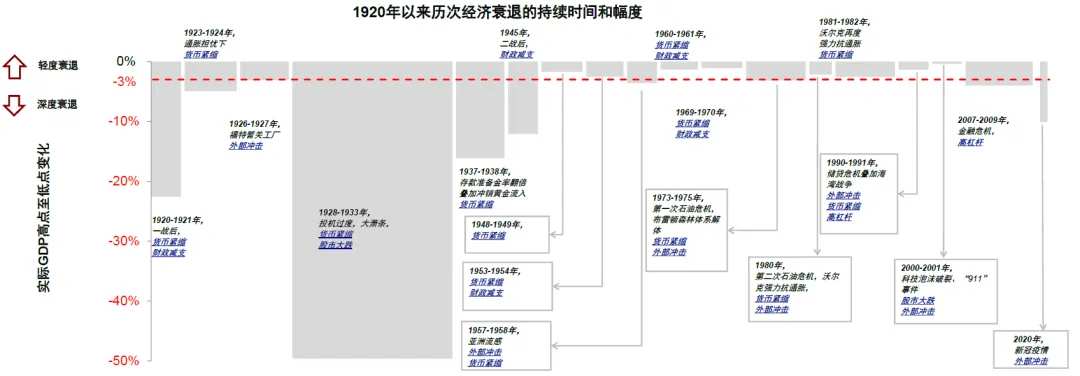
To give an example, in the 1970s and 1980s it was due to the Fed's responding to high inflation caused by supply-side shocks with rapid rate hikes; the Great Depression in 1929 and the bursting of the 2000 dotcom bubble were more due to large-scale speculation and overvaluation pushing up US stocks and triggering systemic financial risks; 1920, 1945, 1953, and 1969 were mainly due to significant cuts in post-war government spending. In summary, among the factors that have triggered 18 recessions, monetary contraction accounted for 14 times, fiscal austerity 5 times, high leverage twice, stock market crash twice, and external shocks 7 times.
Chart: Overview of inflation and unemployment rates before and after past recessions since the 1920s.
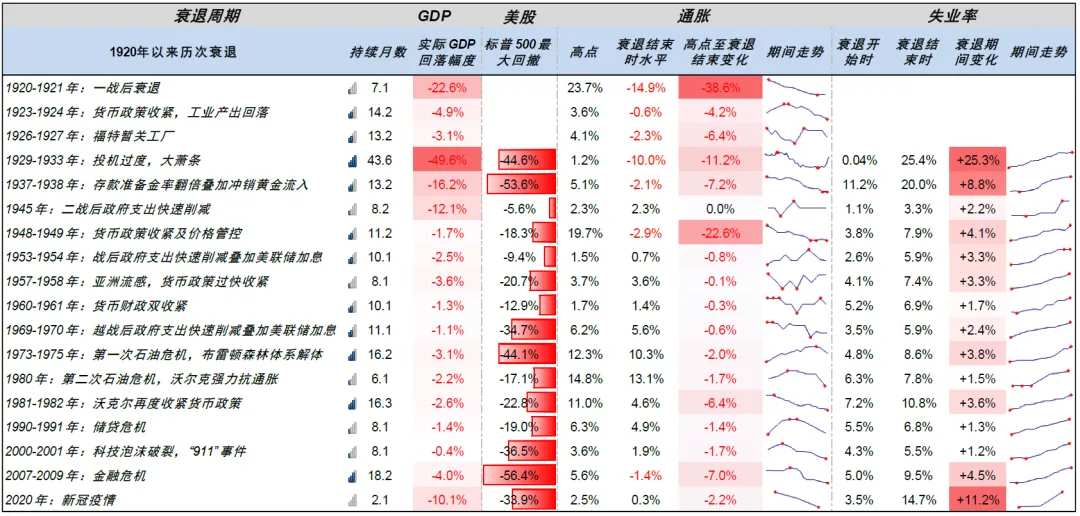
Chart: Overview of monetary policy, fiscal policy, and triggering factors before and after past recessions since the 1920s.
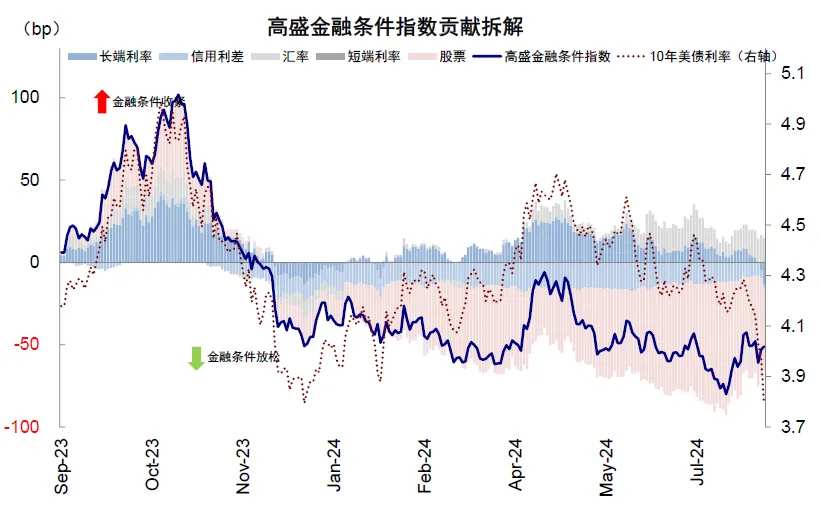
Combined with the current situation, most of the above factors that trigger a recession are under control: 1) Monetary contraction is the main contradiction, but it is expected to ease relatively quickly. On the one hand, the "dovish" statement and post-meeting interviews of the Fed's July meeting have pushed the consensus expectation for a rate cut in September. At present, the expectation for a 50bp rate cut is also brewing. On the other hand, the market is trading significantly looser, with US bond yields dropping below 3.8% and the US dollar index weakening, which helps hedge the tightening of financial conditions brought about by the decline in US stocks; ("19")
Chart: Falling stocks lead to a tighter financial condition.
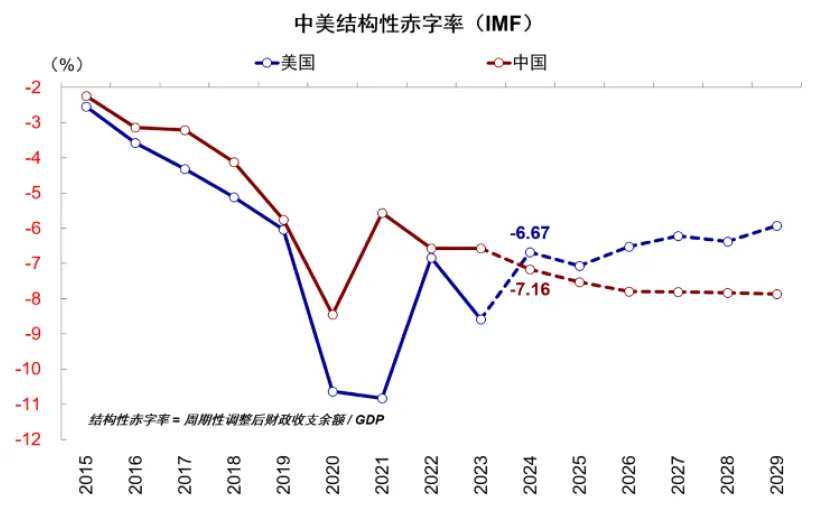
2) Fiscal austerity has limited scope. Although the pace of fiscal expansion this year is not as fast as that in 2023, overall, the fiscal policy is still relatively proactive. According to IMF's prediction, the structural deficit rate of the United States in 2024[2] is still close to 6.7%, higher than the highest level before the epidemic in 2015-2019.
Figure: The structural deficit rate of the United States in 2024 is still close to 6.7%, higher than the highest level before the epidemic in 2015-2019.
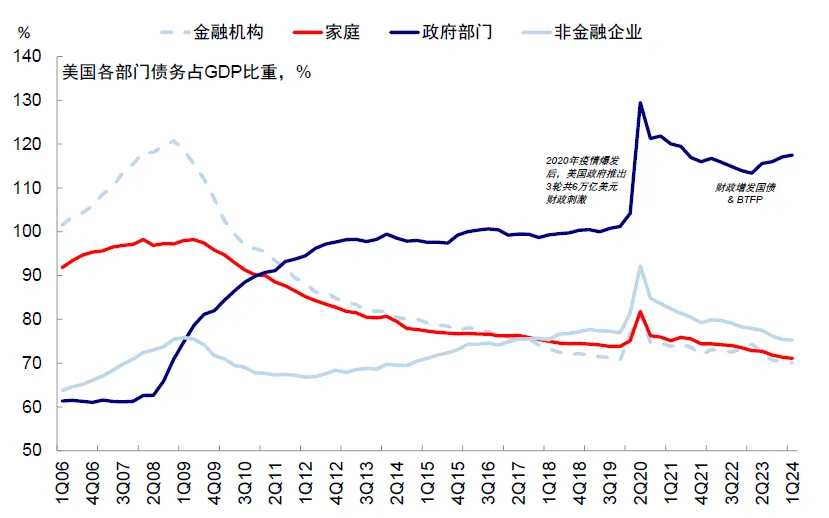
3) The leverage ratio of the private sector is low. The household, financial, and non-financial corporate sectors have been deleveraging since the financial crisis and are currently relatively healthy.
Figure: The household, financial, and non-financial corporate sectors have been deleveraging since the financial crisis and are currently relatively healthy.
4) There are risks of a stock market crash and external shocks, and the recession narrative that arises after the fundamental data weakens may also be amplified by a stock market crash and external shocks. For example, the recession from the stock market's over-speculation to the Great Depression and the 2001 burst of the technology bubble superimposed with the outbreak of the '911' incident interrupted the United States' expansion cycle for 10 years after World War II, both recessionary cycles were caused by economic recession triggered by stock market declines. Moreover, in macro narratives, the excessive emotional reactions strengthened the anticipated recession. But in a step back, as long as it is not debt related to the balance sheet, a larger rate cut and a faster pace can help solve the problem.
Experience in recession: Investment noticeably declines, if the degree of recession is deeper, risk assets continue to be under pressure, and repair gradually occurred after late recession.
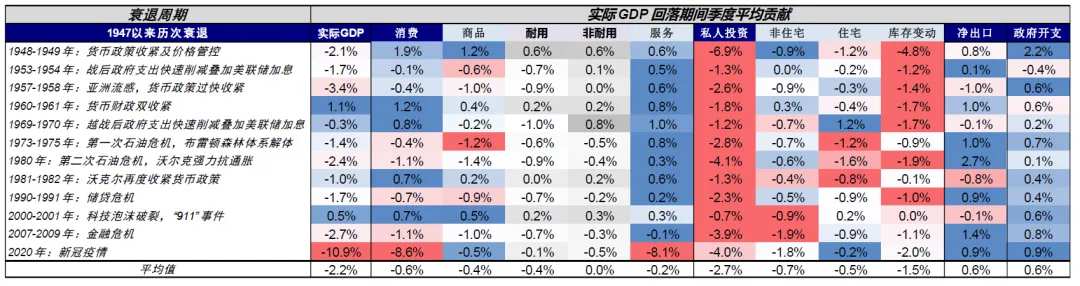
What is the fundamental situation during a recession? By calculating the quarterly contributions of actual GDP during the recession period, we found that the average contributions of consumption, investment, and government spending were -0.6%, -2.7%, and 0.6%, respectively. This shows that the recession has a restraining effect on consumption, but non-durable goods still have resilience. Government spending was negative only once in the past 12 recessions, indicating that the government tends to increase fiscal spending to deal with economic downturns. In contrast, private sector investment has created significant drag on the economy in all 12 recession rounds, with a significantly higher drag than consumption and government spending.
Figure: Private sector investment has a significantly higher drag on the economy than consumption and government spending.
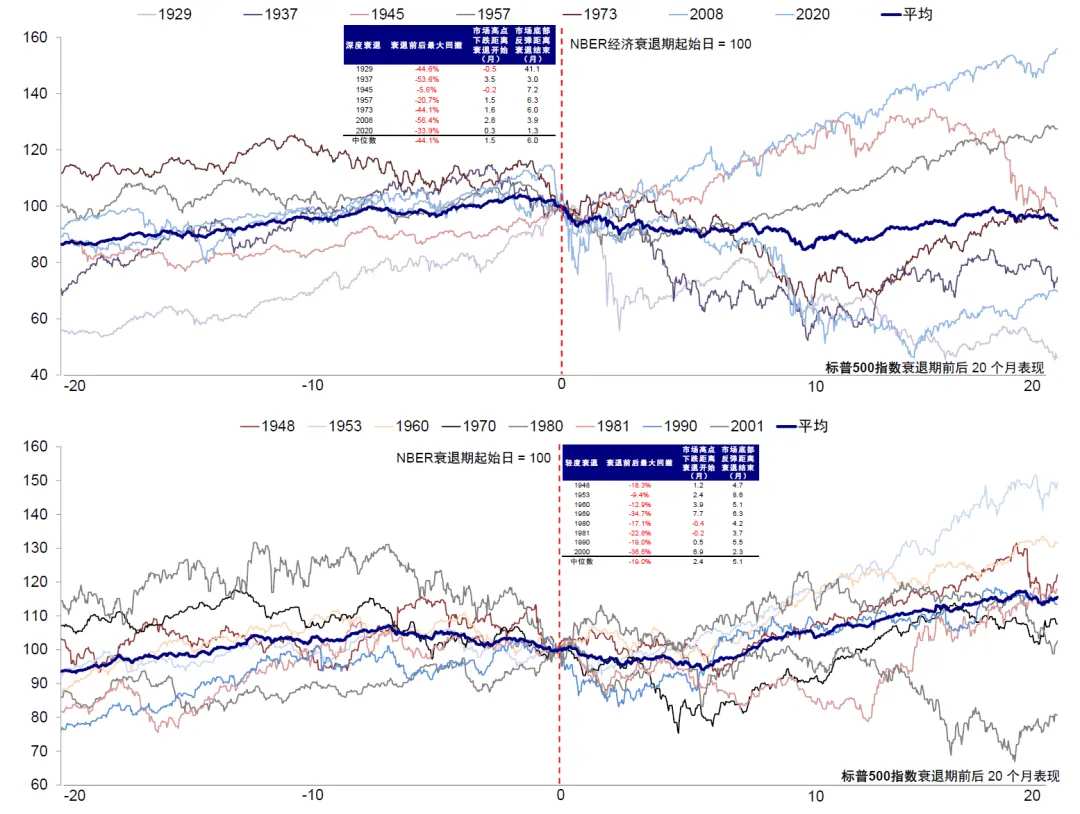
How do assets perform during a recession period? If the degree of recession is deeper, risk assets continue to be under pressure. We define the degree of recession by the extent to which actual GDP falls from its peak, and the empirical value considers a decline of more than 3% as a deep recession and less than 3% as a mild recession. Since the 1920s, there have been a total of 10 deep recessions and 8 mild recessions.
1) Overall performance: Before and after the beginning of deep recession, the S&P 500's largest drawdown median was 44%, much higher than the maximum drawdown of 19% during mild recession.
Figure: Compared with a mild recession, the market decline during deep recessions is greater, and the starting point and recession period are closer, but the end time is exactly the opposite.
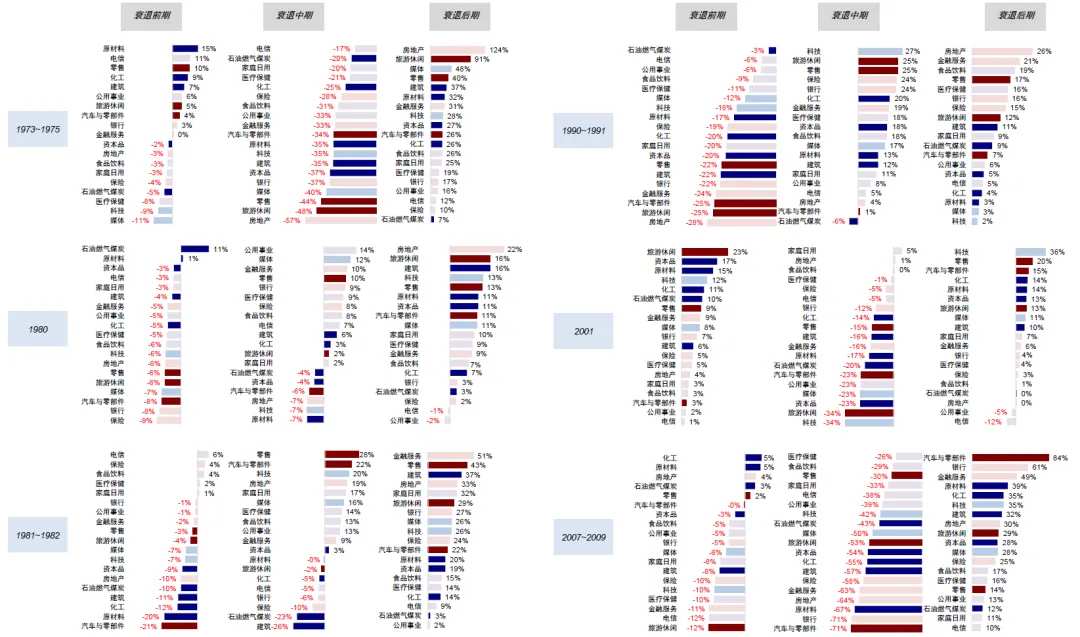
2) Industry performance: In the drawdown period, daily consumption and defense sectors generally have smaller declines, consistent with the characteristics of defense sectors. However, real estate, financial services, media, utilities, insurance, and other sectors experience more severe declines during a deep recession, indicating that these sectors are more sensitive to a recession. In contrast, the sensitivity of growth-style technology sectors is relatively low.
Figure: The daily consumption and defense sectors generally have smaller declines during the decline of the US stock market and are consistent with the characteristics of defensive sectors; however, real estate, financial services, media, and utilities all experienced more severe declines during the deep recession.

In addition, asset performance differs at different stages of a recession: 1) In the early stages, crude oil is the best, followed by gold and bonds, with the US dollar and industrial metals generally performing averagely. Emerging and growth stocks and credit bonds lag behind. Leading the upper- and middle-cycle are unattractive in defense/daily consumption while the finance and real estate sectors, as well as technology and optional consumption, are not good; 2) In the middle stage, crude oil and industrial metals fall back, bonds perform the best, and US stocks recover. Defense/daily consumption is the best, upper- and middle-cycle fall back, while finance and real estate recover along with technology; 3) In the later stage, US stocks, emerging markets, and industrial metals recover, bonds are average, crude oil lagged, and gold is the worst. Finance and real estate, as well as optional consumption, are the best, upper- and middle-cycle along with technology and media recover, while defense/daily consumption is the worst.
Figure: Overview of asset performance during early, middle, and late stages of recession.
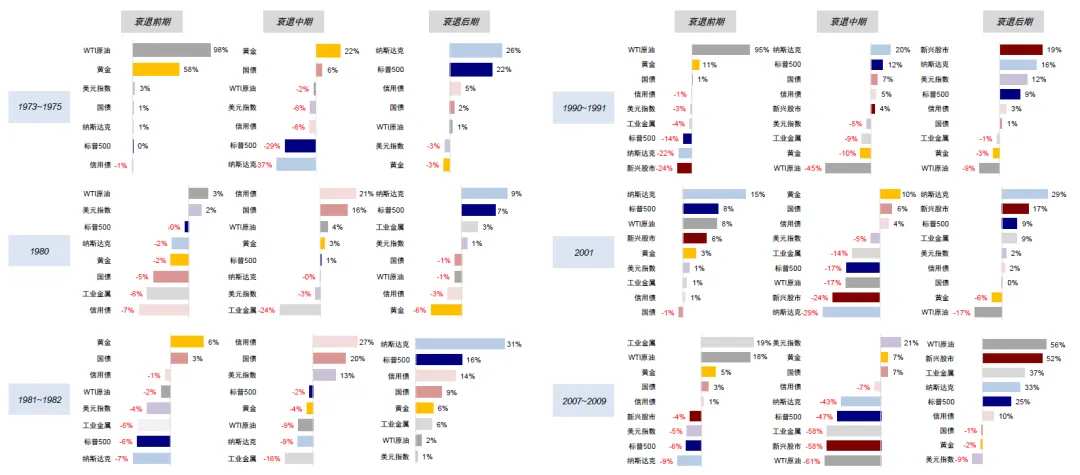
Figure: Overview of US stock market industry performance during early, middle, and late stages of recession.
Under the pressure of economic slowdown rather than systemic recession, the risk asset sell-off has basically ended after the rate cut of safe-haven assets, providing better entry opportunities for risk assets' pullback.
We have been suggesting that the Fed can cut interest rates, and we see that monetary policy is in a restrictive range, with financial conditions tightening will cause growth to slow down and inflation to ease. However, we do not fully endorse the market sentiment that swings to another extreme of "recession worries", just as we did not endorse the market's excitement for the global investment cycle to open when copper prices rose to $11,000 per ton in May ("Does the global manufacturing and restocking cycle begin now?"). Therefore, there is no need to resist the market in the short term, waiting for expectations to digest, but also not to over-amplify panic. Even in the small cycle of interest rate cuts three times in 2019, before the interest rate cut, the stock market and copper all fell.Has the global manufacturing and restocking cycle begun?From the perspective of assets, under the basic assumption of economic "soft landing" and Fed's slight interest rate cut, before the rate cut, the denominator end (such as US Treasuries, gold) assets can still be done and have greater elasticity, while the molecular end risk assets (such as US stocks, copper, etc.) will face pressure. This is also a typical "routine" for each interest rate cut trading ("Interest rate cut trading manual"). However, the "special" thing about this one is the pace. If based on the hypothesis of slowdown but not recession, similar to 2019, after the rate cut is realized, assets will also catch up, which also explains the performance of gold falling on Friday.
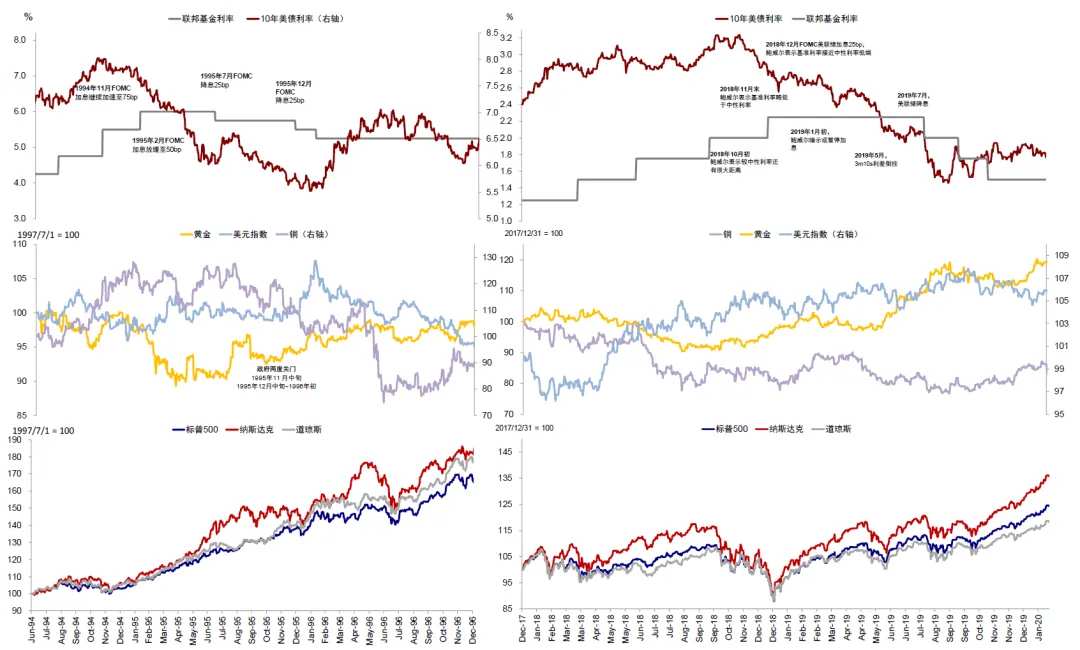
Chart: U.S. stocks did not fall before or after the 1995 rate cut, and in 2019, U.S. stocks experienced a phased correction but quickly regained upward momentum.
► Before the rate cut starts, those who benefit from easy interest rate trading can still participate. Assets benefiting from the improvement of liquidity on the denominator end before the rate cut still have some space and greater elasticity. However, due to the lack of other benefit logic, it is necessary to grasp the rhythm of "fighting and retreating", such as US Treasuries, gold and small-cap stocks with no profit support; the molecular end risk assets face pullback pressure, but it will not continue to bear pressure in the case of non-recession and provide entry opportunities for subsequent periods.After the rate cut is realized, assets that can solve both the molecular and denominator problems will be better. After the rate cut, assets benefiting from the demand-lifting brought about by the decline in financing costs, and then improving earnings on the molecular end, will have relatively increased relative value. After the rate cut is realized, it may also be the end of the interest rate cut trading, gradually turning to inflation-benefiting assets, such as US stocks and bulk resources such as copper and oil.However, the uniqueness of this time is the rhythm. If it is based on the assumption of slowing down but not recession, similar to 2019, the interest rate cut will gradually end, and assets will also run ahead, so you need to take a step ahead, which also explains the gold's decline on Friday.
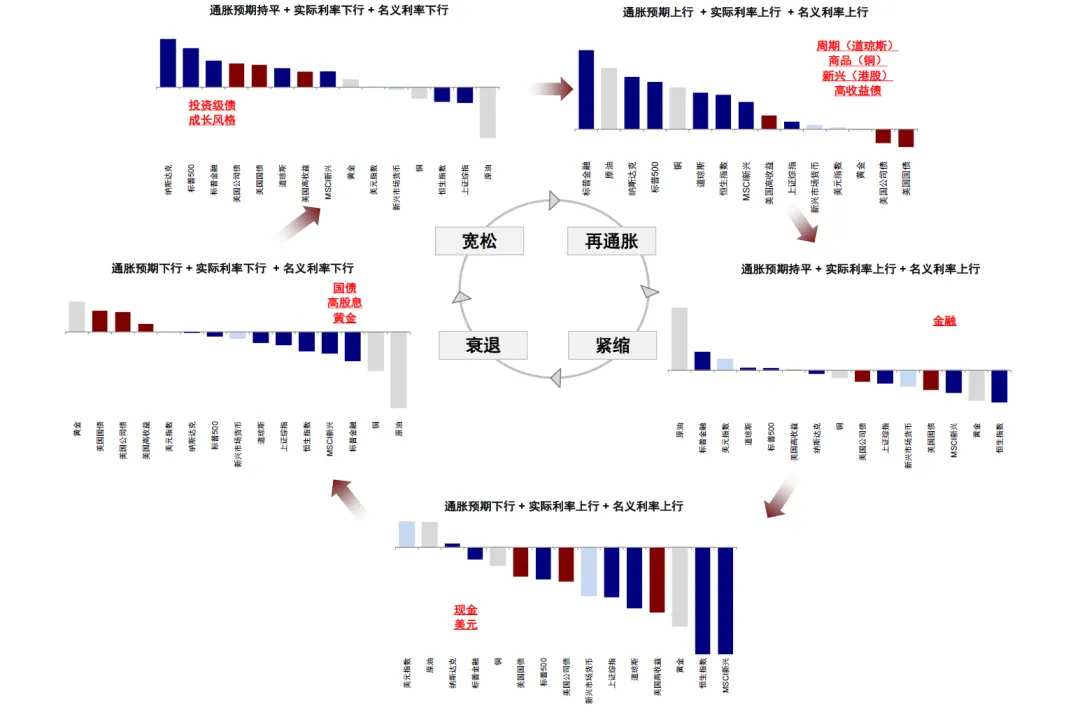
Chart: Corrections actually provide better entry opportunities for trades that benefit from interest rate cuts. The current loose trades have passed halftime, and inflationary trades have not yet been completed.
► Before the rate cut starts, those who benefit from easy interest rate trading can still participate. Assets benefiting from the improvement of liquidity on the denominator end before the rate cut still have some space and greater elasticity. However, due to the lack of other benefit logic, it is necessary to grasp the rhythm of "fighting and retreating", such as US Treasuries, gold and small-cap stocks with no profit support; the molecular end risk assets face pullback pressure, but it will not continue to bear pressure in the case of non-recession and provide entry opportunities for subsequent periods.
After the rate cut is realized, assets that can solve both the molecular and denominator problems will be better. After the rate cut, assets benefiting from the demand-lifting brought about by the decline in financing costs, and then improving earnings on the molecular end, will have relatively increased relative value. After the rate cut is realized, it may also be the end of the interest rate cut trading, gradually turning to inflation-benefiting assets, such as US stocks and bulk resources such as copper and oil.
[1] https://www.barrons.com/articles/sahm-rule-recession-4b114b90
[2] Structural deficit refers to the fiscal deficit after cyclical adjustments, that is, without considering the economic cycle
Article Source
This article is excerpted from "Criteria and Historical Experience for Judging Recessions" published on August 4, 2024
Liu Gang, CFA analyst SAC certification number: S0080512030003 SFC CE Ref: AVH867 Wang Zilin, SAC certification number: S0080123090053
Contact person Wang Zilin, SAC certification number: S0080123090053.
Editor/Emily