
David Iben put it well when he said, 'Volatility is not a risk we care about. What we care about is avoiding the permanent loss of capital.' So it might be obvious that you need to consider debt, when you think about how risky any given stock is, because too much debt can sink a company. As with many other companies Enerpac Tool Group Corp. (NYSE:EPAC) makes use of debt. But the real question is whether this debt is making the company risky.
When Is Debt A Problem?
Debt assists a business until the business has trouble paying it off, either with new capital or with free cash flow. Ultimately, if the company can't fulfill its legal obligations to repay debt, shareholders could walk away with nothing. However, a more common (but still painful) scenario is that it has to raise new equity capital at a low price, thus permanently diluting shareholders. Of course, debt can be an important tool in businesses, particularly capital heavy businesses. The first thing to do when considering how much debt a business uses is to look at its cash and debt together.
What Is Enerpac Tool Group's Net Debt?
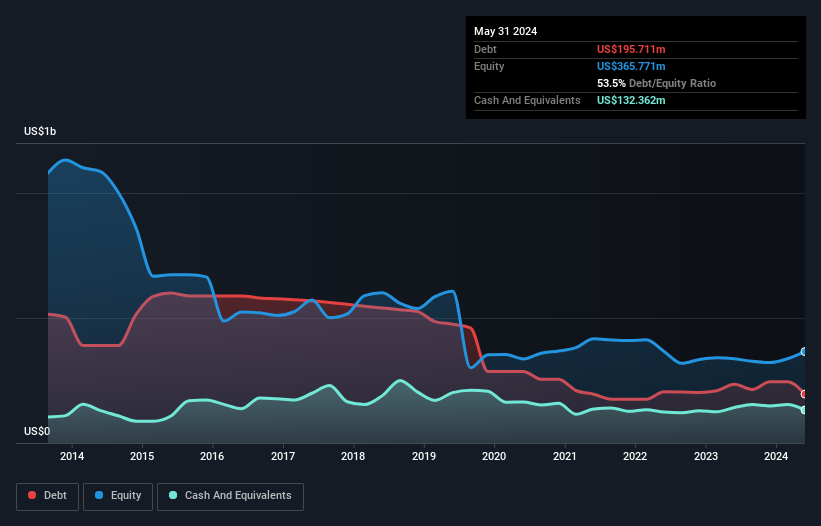
You can click the graphic below for the historical numbers, but it shows that Enerpac Tool Group had US$195.7m of debt in May 2024, down from US$234.7m, one year before. On the flip side, it has US$132.4m in cash leading to net debt of about US$63.3m.
A Look At Enerpac Tool Group's Liabilities
 We can see from the most recent balance sheet that Enerpac Tool Group had liabilities of US$122.0m falling due within a year, and liabilities of US$261.7m due beyond that. Offsetting this, it had US$132.4m in cash and US$113.5m in receivables that were due within 12 months. So its liabilities outweigh the sum of its cash and (near-term) receivables by US$137.9m.
Given Enerpac Tool Group has a market capitalization of US$2.18b, it's hard to believe these liabilities pose much threat. However, we do think it is worth keeping an eye on its balance sheet strength, as it may change over time.
In order to size up a company's debt relative to its earnings, we calculate its net debt divided by its earnings before interest, tax, depreciation, and amortization (EBITDA) and its earnings before interest and tax (EBIT) divided by its interest expense (its interest cover). This way, we consider both the absolute quantum of the debt, as well as the interest rates paid on it.
Enerpac Tool Group has a low net debt to EBITDA ratio of only 0.42. And its EBIT easily covers its interest expense, being 10.4 times the size. So you could argue it is no more threatened by its debt than an elephant is by a mouse. Also positive, Enerpac Tool Group grew its EBIT by 28% in the last year, and that should make it easier to pay down debt, going forward. The balance sheet is clearly the area to focus on when you are analysing debt. But ultimately the future profitability of the business will decide if Enerpac Tool Group can strengthen its balance sheet over time. So if you're focused on the future you can check out this free report showing analyst profit forecasts.
But our final consideration is also important, because a company cannot pay debt with paper profits; it needs cold hard cash. So the logical step is to look at the proportion of that EBIT that is matched by actual free cash flow. During the last three years, Enerpac Tool Group produced sturdy free cash flow equating to 59% of its EBIT, about what we'd expect. This cold hard cash means it can reduce its debt when it wants to.
Our View
Happily, Enerpac Tool Group's impressive EBIT growth rate implies it has the upper hand on its debt. And that's just the beginning of the good news since its net debt to EBITDA is also very heartening. Zooming out, Enerpac Tool Group seems to use debt quite reasonably; and that gets the nod from us. While debt does bring risk, when used wisely it can also bring a higher return on equity. Over time, share prices tend to follow earnings per share, so if you're interested in Enerpac Tool Group, you may well want to click here to check an interactive graph of its earnings per share history.
When all is said and done, sometimes its easier to focus on companies that don't even need debt. Readers can access a list of growth stocks with zero net debt 100% free, right now.
Have feedback on this article? Concerned about the content? Get in touch with us directly. Alternatively, email editorial-team (at) simplywallst.com.
This article by Simply Wall St is general in nature. We provide commentary based on historical data and analyst forecasts only using an unbiased methodology and our articles are not intended to be financial advice. It does not constitute a recommendation to buy or sell any stock, and does not take account of your objectives, or your financial situation. We aim to bring you long-term focused analysis driven by fundamental data. Note that our analysis may not factor in the latest price-sensitive company announcements or qualitative material. Simply Wall St has no position in any stocks mentioned.
Have feedback on this article? Concerned about the content? Get in touch with us directly. Alternatively, email editorial-team@simplywallst.com