
Recently, fluctuations in overseas markets have increased. In particular, US stocks retreated sharply after the performance of Tesla and Google fell short of expectations last week. The S&P 500 and NASDAQ indices plummeted 2.3% and 3.6% in a single day on July 24, the biggest one-day decline since 2022, causing widespread concern and even panic. Moreover, commodities such as copper and crude oil have also continued to weaken recently, creating a situation where risk assets are falling across the board. Combined with the market's “inherent” impression that interest rate cuts and recessions often follow, all of this has increased concerns that the US economy will gradually fall into recession. However, careful investors may also notice that, if summed up only by “recession trading,” the performance of some assets is difficult to explain, such as a sharp drop in gold, a rise in interest rates on long-term US bonds, and a steeper yield curve on US bonds.
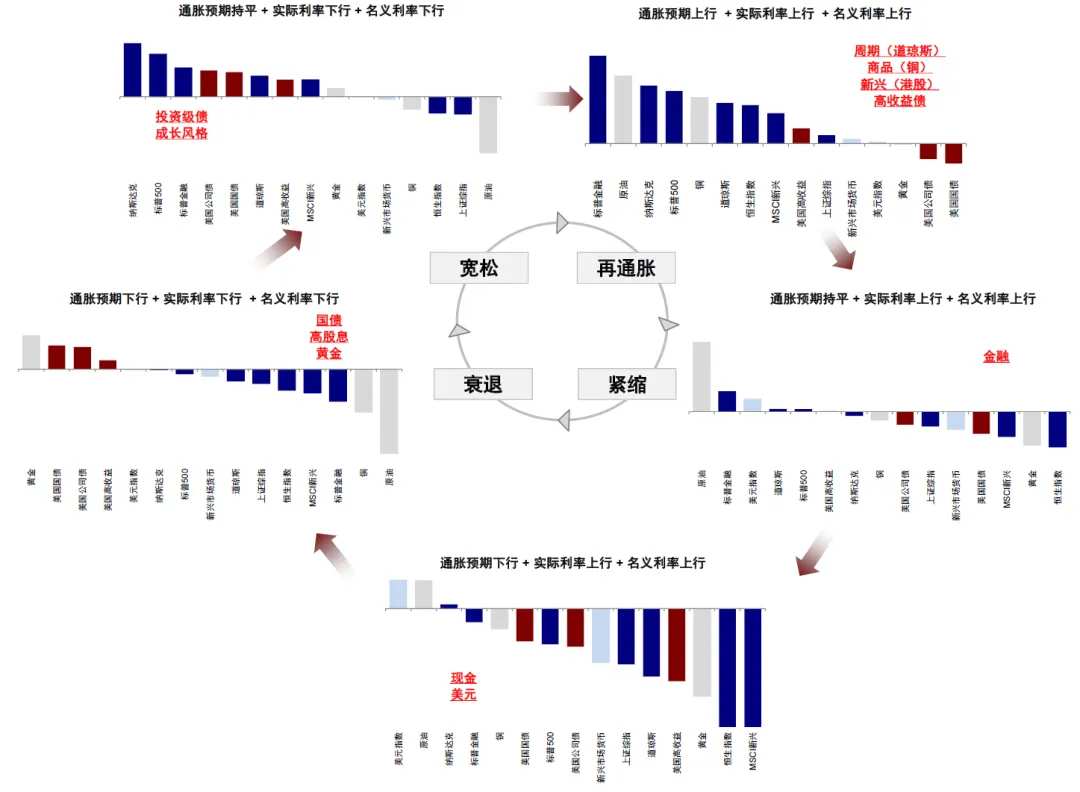
Determining where the quasi-cycle is located is critical to grasping the main line assets. Will the US economy go into recession, repair, or stagflation? Are current global markets and assets trading in recession? What are the assets of the sharp decline in the market and recent chaos being traded? We will give the analysis and answers in this article.
1. Is it currently a “recession deal”? Unlike, there are no clear signs or basis of recession; long-term debt and interest rate curves do not match the trend of gold
We don't fully agree with the current market's judgment that trading is in recession. It is mainly based on the following two reasons: First, there is currently no clear evidence or signal that the US economy is facing recessionary pressure. The newly announced annualized growth rate of 2.8% of US GDP for the second quarter not only exceeded expectations of 2%, but also significantly better than 1.4% in the first quarter; overall in June, as well as the core PCE, exceeded expectations. If there is a growth factor in the general pullback in risky assets, it is more a slowdown in growth than a recession.
Chart: Determining where the quasi-cycle is located is essential for grasping main line assets
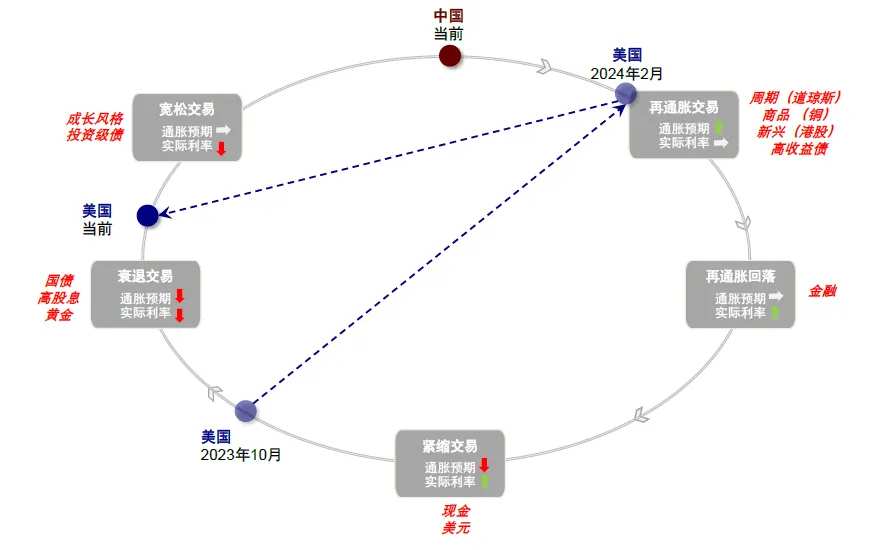
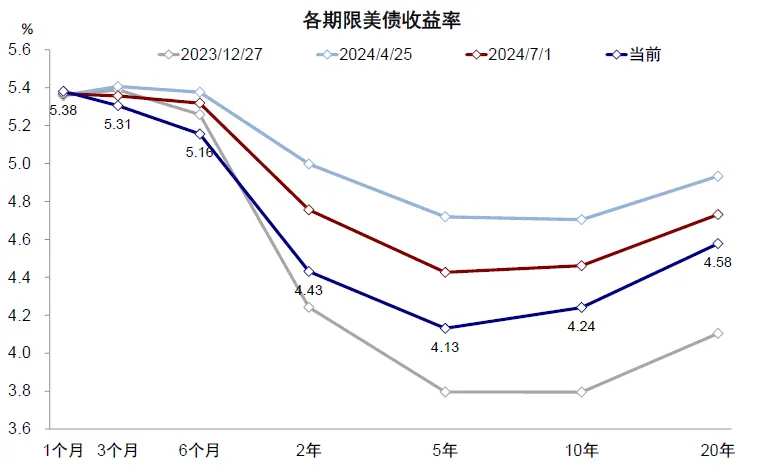
Second, the performance of some assets is clearly inconsistent with recession transactions. Typical assets that benefit from the recession, such as long-term US bonds and gold, have generally weakened recently. During the sharp decline in US stocks, gold fell 2.2%, and interest rates on US bonds once approached 4.3% from 4.2%. If a sharp drop in US stocks means “recession trading,” then safe-haven assets that benefit from the recession, such as gold and US bonds, should rise. Moreover, the interest rate curve shows a “steepening” of short-term interest rates falling and long-term interest rates remaining flat, which is not in line with the characteristics of recessionary transactions. If market transactions are expected to decline, the change in the interest rate curve is more because interest rates in the long and short term are falling together and falling faster in the short term. We have reviewed each recession cycle and found that the 2s10s interest rate spreads and 10-year US Treasury interest rates were mostly the same before the recession. However, interest rates on long-term bonds have changed little or even slightly increased recently, while interest rates on 2-year US bonds have rapidly declined, easing expectations, which is not in line with the characteristics of “recession trading.”
Chart: On July 24, gold, copper, and US bonds accompanied the joint decline of US stocks. This is not a typical “recession transaction”
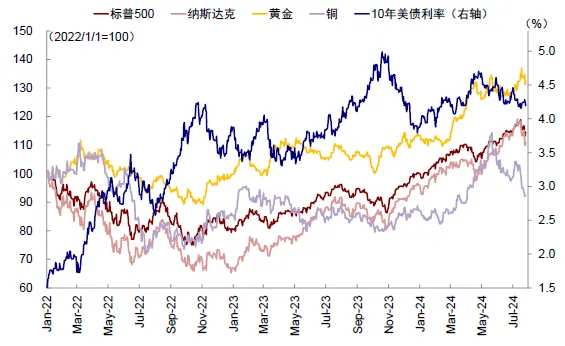
Chart: Interest rates on long-term bonds have not changed much at present. Interest rates on 10-year US bonds fluctuate around 4.2%, but the fall in interest rates on short-term bonds has led to a steeper curve
2. What is the market trading? There are factors slowing growth, but it is more of a profit backlash amplified by macroeconomic uncertainty and trading factors
If not recession trading, what is the market trading? Admittedly, the pullback in some risky assets cannot be said to have no growth factors, but it is more a reflection of a normal slowdown in growth (otherwise the Federal Reserve would not have to cut interest rates), so simply “equating” with the recession is likely to amplify it.
In contrast, we believe that recent fluctuations in risk assets, especially in US stocks, have been fueled by macroeconomic variables (such as “big and small” capital rotation in US stocks after interest rate cuts are expected to heat up, Trump's transactions suppressing copper, oil, and new energy), and further amplified by sentiment and trading factors (such as some hedge funds choosing to temporarily close previous transactions before high volatility and unclear direction), causing increased volatility and logical “confusion.” Specifically,
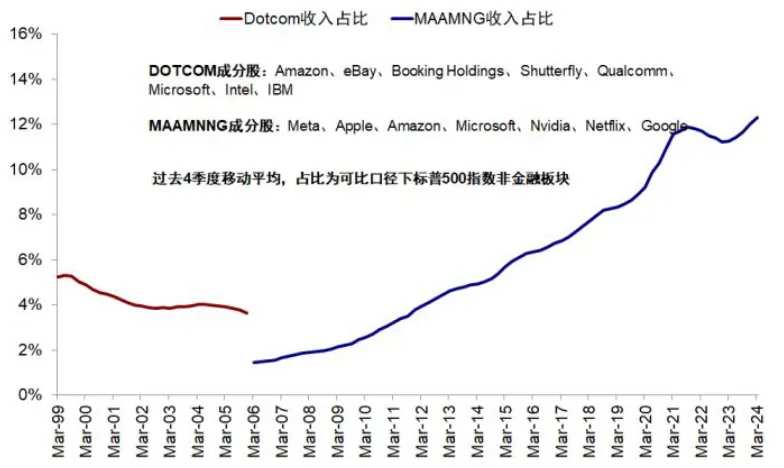
► The performance of leading individual stocks fell short of expectations, such as Tesla and Alphabet, which directly triggered the sharp decline in US stocks. Google's parent company Alphabet's second-quarter results were generally in line with expectations, but YouTube ad revenue fell short of expectations [1]; Tesla's overall performance fell below expectations, and car revenue fell 7% year over year [2]. Both companies' results were announced on the 23rd, and fell 5.0% and 12.3% respectively on the 24th, dragging down market performance. Leading individual stocks are the main driver of the sharp rise in US stocks since 2023, and they also have a large profit margin, so their performance has a strong demonstration and amplification effect on US stocks as a whole. Currently, the market value of leading US technology companies (MAAMNNG) accounts for 30% of the total market capitalization, far exceeding 16% during the Internet bubble. The concentration level or even “bubble level” is very high. However, the share of revenue, operating cash flow, and net profit in the overall non-financial comparable caliber has risen to 12.3%, 24.1%, and 28.4%, respectively, which is far higher than the 5%, 9%, and 12% during the tech bubble period.
Chart: Alphabet and Tesla fell 5.0% and 12.3% respectively on the 24th, dragging down market performance
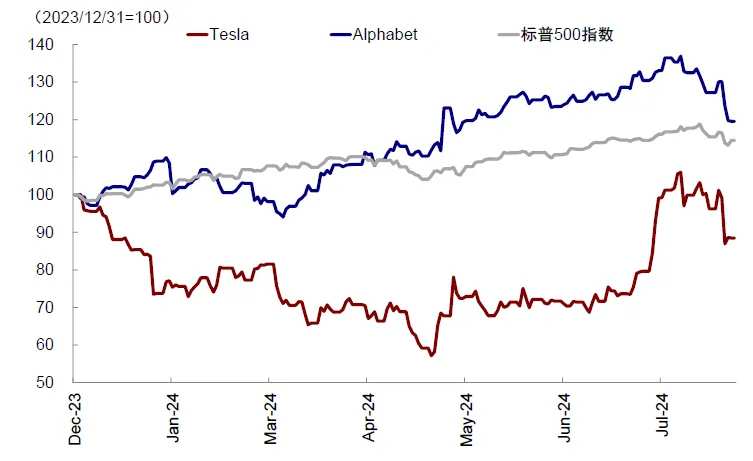
Chart: US tech leaders account for nearly 30% of the overall market capitalization
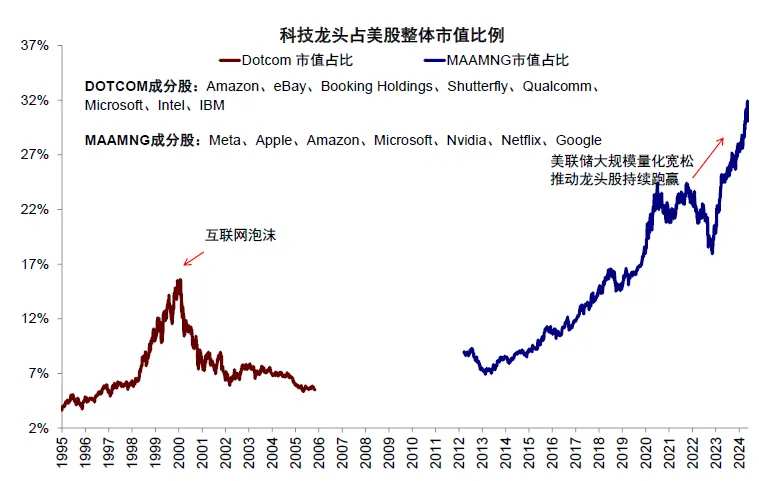
Chart: The share of the revenue of leading US technology companies in the overall non-financial comparable caliber rose to 12%
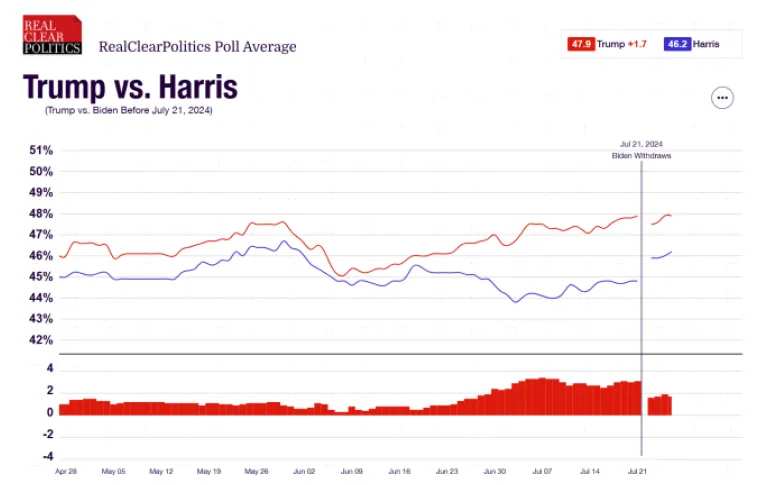
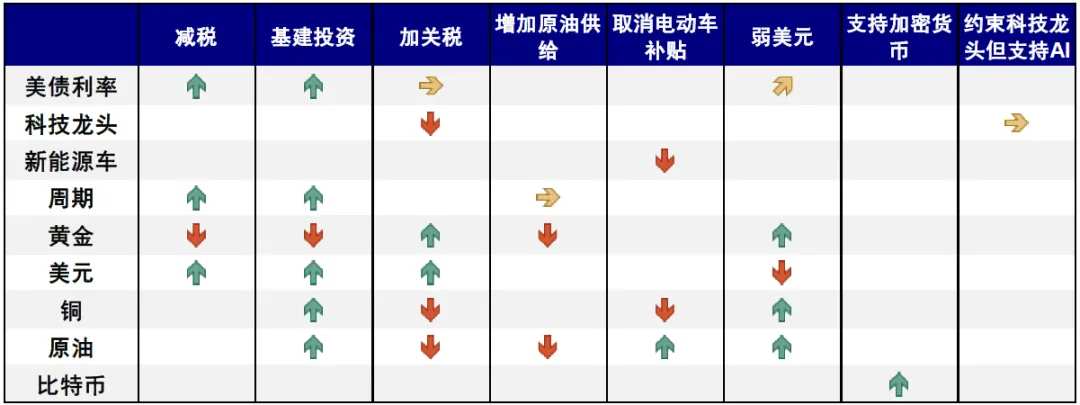
► Trump's deal and interest rate cut deal are intertwined, leading to an increase in macro variables and triggering a rotation among assets. On the one hand, macroeconomic uncertainty will naturally lead to increased volatility, such as changes in interest rate cut expectations and variables in US election results and policies. We have reviewed the historical situation and found that before the November election month, the intensive election situation caused risk appetite to be suppressed, the VIX index rose, and US stocks did not perform well at the same time. The timing of this round of general election debates was brought forward by one quarter, and the rise in Harris polls after Biden's election also increased the variables in the election situation, leading to a reversal of the Trump deal that had heated up earlier.
Chart: Ahead of the November election month, intensive elections will cause risk appetite to be suppressed, and US stocks will not perform well
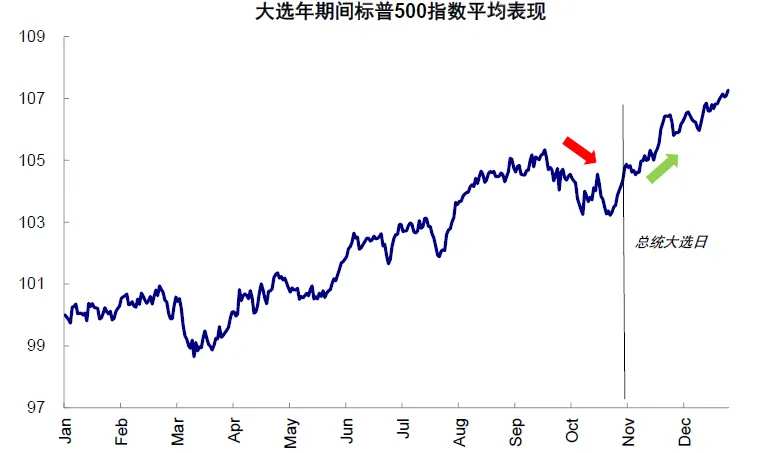
Chart: Harris's possibility of running for election caused the Republican Party and the Democratic Party's poll data gap to return from a previous high of close to 3% to less than 2%
Furthermore, as expectations of interest rate cuts have heated up, assets have also seen a “big to small” rotation from leading technology stocks that previously relied on numerators to liquid small-cap stocks with beneficial denominators. In addition, technology stocks had more profit markets, and their performance fell short of expectations, further amplifying the rotation and switching of capital. Trump's deal has also put a lot of pressure on some assets such as technology stocks, copper, and oil.
Chart: Assets have also seen a “big to small” rotation from leading technology stocks that previously relied on numerators to liquid small-cap stocks with beneficial denominators
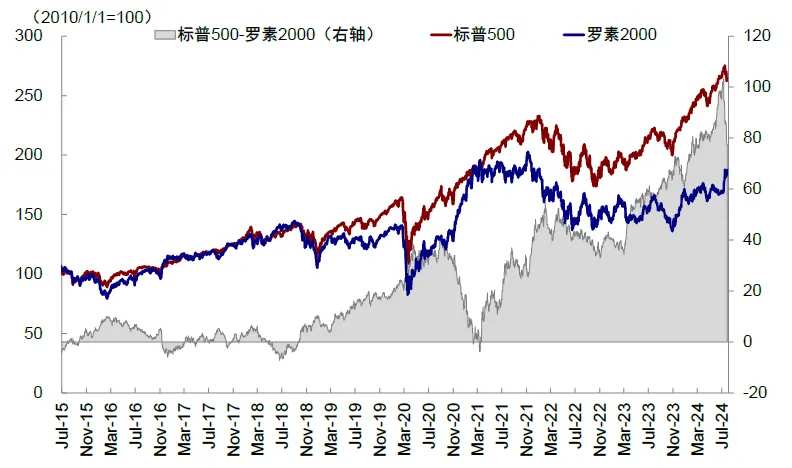
Chart: Trump's deal puts a lot of pressure on assets such as technology stocks, copper, and oil
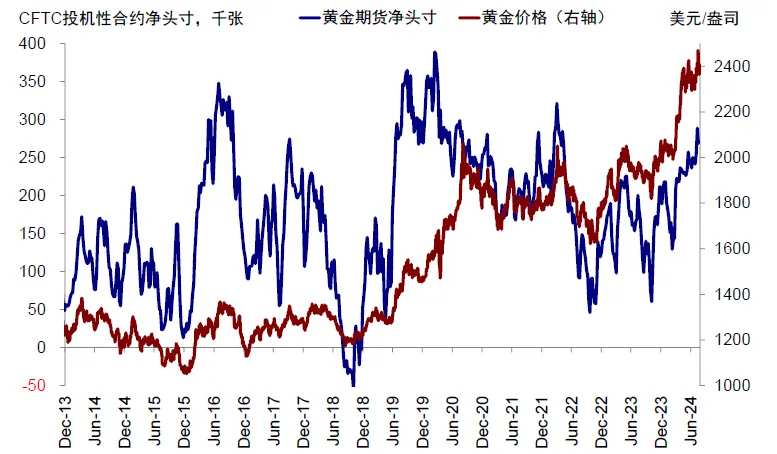
► Concentration of crowding and technical factors amplified fluctuations. Prior to this round of decline, the S&P 500 had an RSI of over 80 on July 10, clearly overbought. Gold and copper were also close to 70, all in a relatively “excited” state. The bully/bearish options ratio in US stocks is close to the high in July 2023 (also the period of the last round of correction in US stocks), and speculative net long positions in gold and copper have also been above the 90% quantile since 2000. The short-term sharp decline in the market may also trigger the closure of some trades.
Chart: The S&P 500 index once exceeded 80 at the RSI point on July 10, clearly overbought
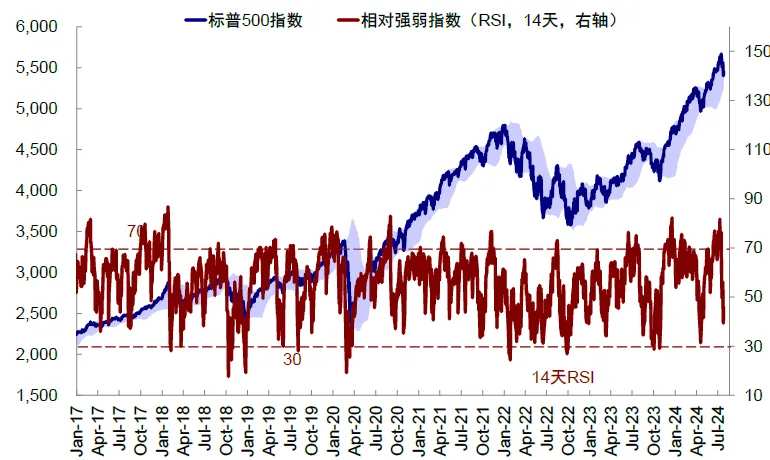
Chart: The ratio of bullish and short options in US stocks is close to the high in July 2023 (also the period of the last round of pullback in US stocks)
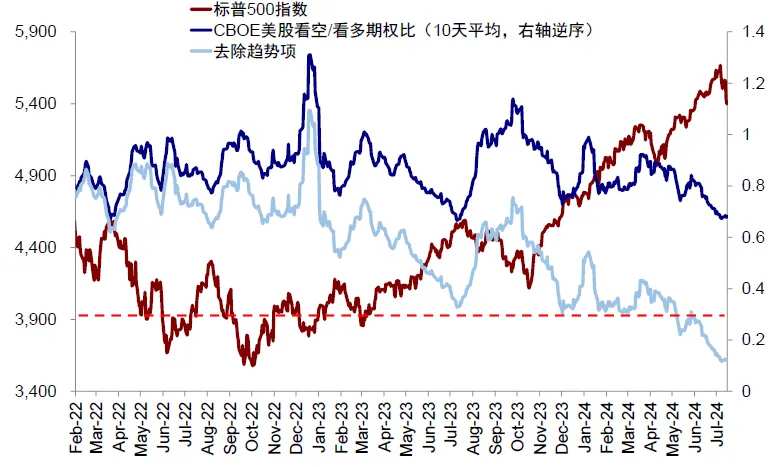
Chart: Net speculative long positions in gold have been above the 90% fraction since 2000
3. Where has the market fallen? Technology stocks led the decline. Risk premiums were the main drag, copper was close to being oversold, and financial conditions were tightened
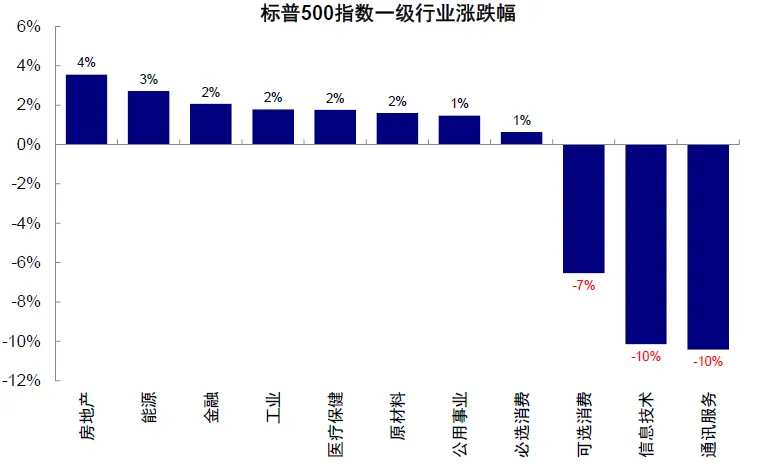
US stocks led the decline in technology, which rotated in a cyclical style. This round of decline in US stocks is not a general decline; it is more spreading outward from a group of technology outlets. Since its peak on July 10, S&P 500 communication services and information technology led the decline, with a decline of 10%, but real estate (4%), energy (3%), finance (2%), and industry (2%) continued to rise. After the correction, the S&P 500 and Nasdaq RSI have now fallen from over 80 to 46.1 and 40.9, respectively. The bearish/long option ratio of CBOE US stocks rose from a low of 0.61 to 0.74, but it is still low, at 33% since 2015.
Chart: Communications services and information technology led the decline in the S&P 500 index since the high point in the range on July 10
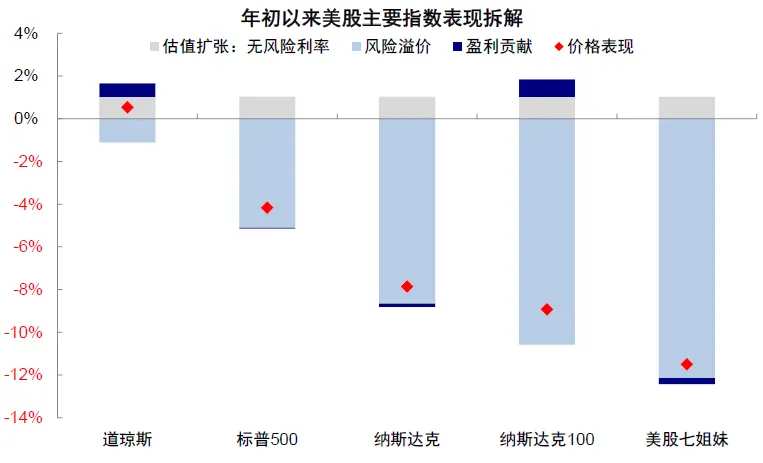
Risk premiums are a major drag. Risk-free interest rates have remained flat, and profit expectations have not changed much. Therefore, the contraction in valuation is mainly due to rising risk premiums, and also reflects the dominant role of sentiment. The US stock “Seven Sisters” fell 11.5%, and rising risk premiums dragged down 12.1%. The Dow Jones index remained up 2.2%, with earnings contributing positively.
Chart: Valuation contraction is mainly due to rising risk premiums, and also reflects a correction mainly driven by emotional factors
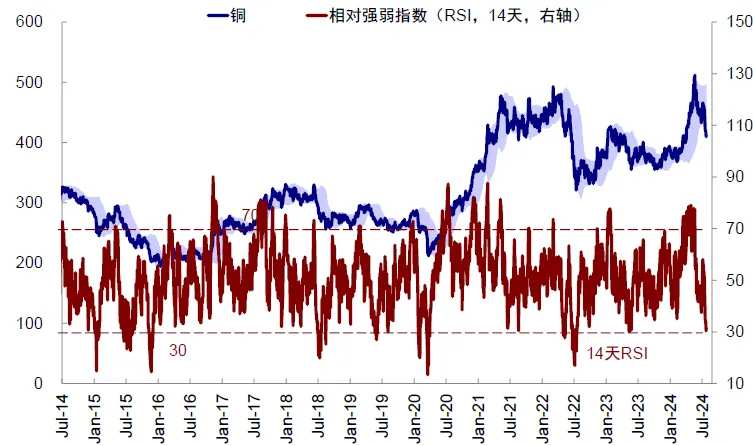
At the level of major asset classes, overbuying of gold has eased somewhat; copper is already close to being oversold, and US bonds are close to being overbought. After experiencing this round of correction, gold eased from the overbought range, and the RSI fell back to 51. Copper is approaching the oversold range, and the RSI has reached 31. The US Treasury Index is close to being overbought, and the RSI point is 61.
Chart: After this round of correction, copper is approaching the oversold range, and the RSI point has reached 31
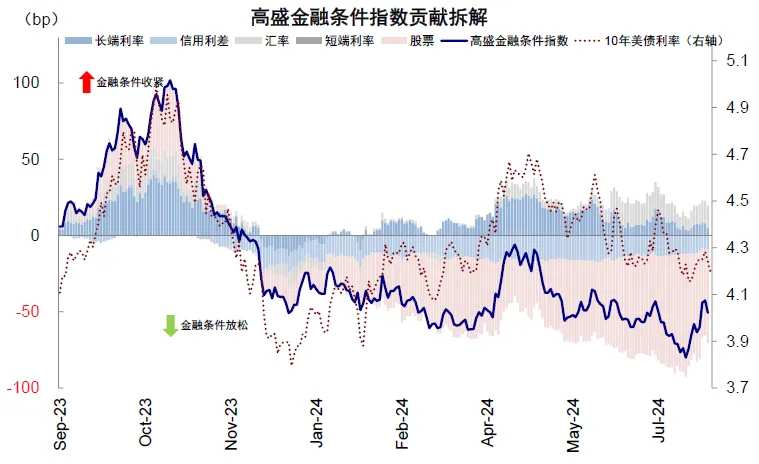
It is worth explaining that risk assets have generally declined recently, and safe-haven assets have not risen sharply, all of which have led to the tightening of financial conditions; on the contrary, this is conducive to the implementation of interest rate cuts by the Federal Reserve. Recent fluctuations caused the Financial Conditions Index to rise from a low of 98.9 on July 16 to 99.3, a new high since June 10. Tightening financial conditions helped curb demand and inflation, and volatile risk assets also helped curb the wealth effect. This in turn helped facilitate the implementation of the Federal Reserve's interest rate cut in September. Just imagine, if the market is “excited” to cut interest rates recently or Trump 2.0. US stocks, copper, and oil surges, and interest rates on US bonds fall rapidly, they may all strengthen economic data again in the next month or two, but in turn bring variables to the September interest rate cut. At the beginning of the year, it was precisely because of excessive trading to cut interest rates that the Federal Reserve postponed interest rate cuts. It is called “the more interest rate cuts are not expected, the more interest rates can be cut.”
Chart: The Financial Conditions Index rose from a low of 98.9 on July 16 to 99.3, a new high since June 10
4. Are there any risks of recession or bear market? The adjustment is a normal phenomenon before interest rate cuts and a slowdown in growth, but it cannot simply be “equated” with a recession
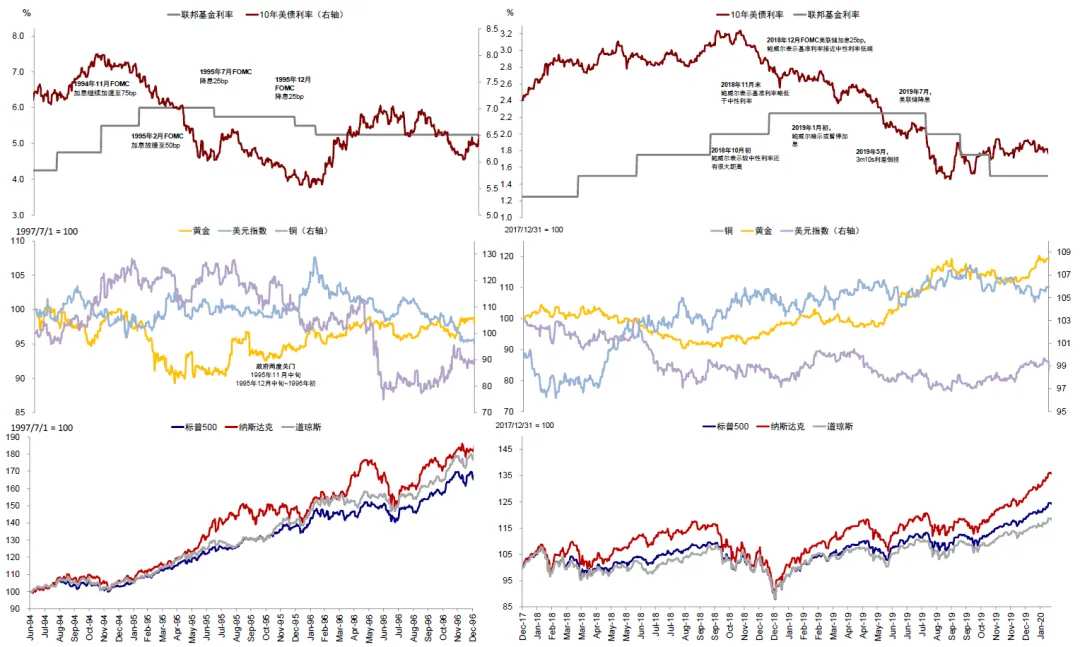
In fact, we have always thought the term “recession” was relatively vague. First, the recession itself is not strictly defined. The NBER's recession cycle was given a more official definition, but the data lags far behind; negative GDP growth in two quarters is not a strict indicator of recession. Second, there is also an essential difference in trading between a simple economic slowdown and a recession. The former can recover quickly after the Federal Reserve adjusts financial conditions. This is reflected in assets, such as the fact that US stocks did not fall before and after the 1995 interest rate cut. In 2019, there was a phased correction in US stocks, but they quickly regained upward momentum. Therefore, if you simply equate a normal and slight slowdown in growth with a recession, you may be too pessimistic about risky assets and too optimistic about safe-haven assets.
Chart: US stocks did not fall before or after interest rate cuts in 1995. Although US stocks had a phased correction in 2019, they quickly regained their upward momentum
Our judgment on the current situation is that the economy is in a slowing down channel (which is why the Federal Reserve needs and can cut interest rates), but there are no signs or basis for a recession. The US economy itself is on a slowing path, but the slope was flatter due to unexpected leverage from residents and businesses at the beginning of the year. Since the balance sheet is healthy, financing costs only slightly exceed the return on investment (for example, residents' mortgage interest rates are basically the same as rental returns), and the “rolling” misalignment between various aspects of the economy, such as consumption, real estate, and investment, all make this cycle clearly “atypical,” so there are no obvious signs or basis of recession, unless there is an unexpected external shock. Next, if the Federal Reserve starts a cycle of interest rate cuts, it can instead encourage links sensitive to interest rates, such as real estate and investment, to hedge against the gradual slowdown in residents' service consumption.
Chart: If interest rates on US bonds fall back to 4%, US existing home sales may increase 2% to 4% year over year

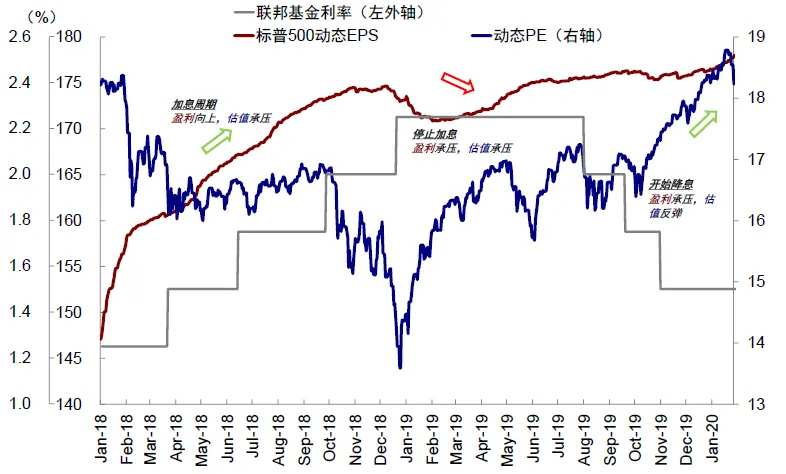
In this process, it is normal for growth and profits to decline. Take 2019 as an example. This is also the background of a soft economic landing. US stock profits and valuations also experienced a three-stage process where profits increased during the interest rate hike cycle, and valuations were under pressure; when interest rate hikes were stopped, valuations were still under pressure, and profits were also under pressure; after interest rate cuts began, valuations were first repaired, and profits were still under pressure. Against the backdrop of slowing profits, US stocks showed a 6.8% and 6.1% correction before interest rate cuts in May 2019 and when interest rates were cut for the first time in July 2019, respectively. Other risk assets such as copper and oil also recovered at the beginning and during the period of interest rate cuts. When profits and valuations “go wrong” at the beginning of interest rate cuts, the fluctuation of US stocks will increase. This is one of the reasons we have always prompted US stocks to “hold back and then rise” and “don't fall, don't buy.” However, there is no need to be too pessimistic about the medium-term growth prospects. If the decline is limited, and the Fed's interest rate cut can have a positive effect, then there is no need to be too worried or pessimistic, that is, “if it falls too much, you can buy it back.”
Chart: Pressure on corporate profits is a normal phenomenon
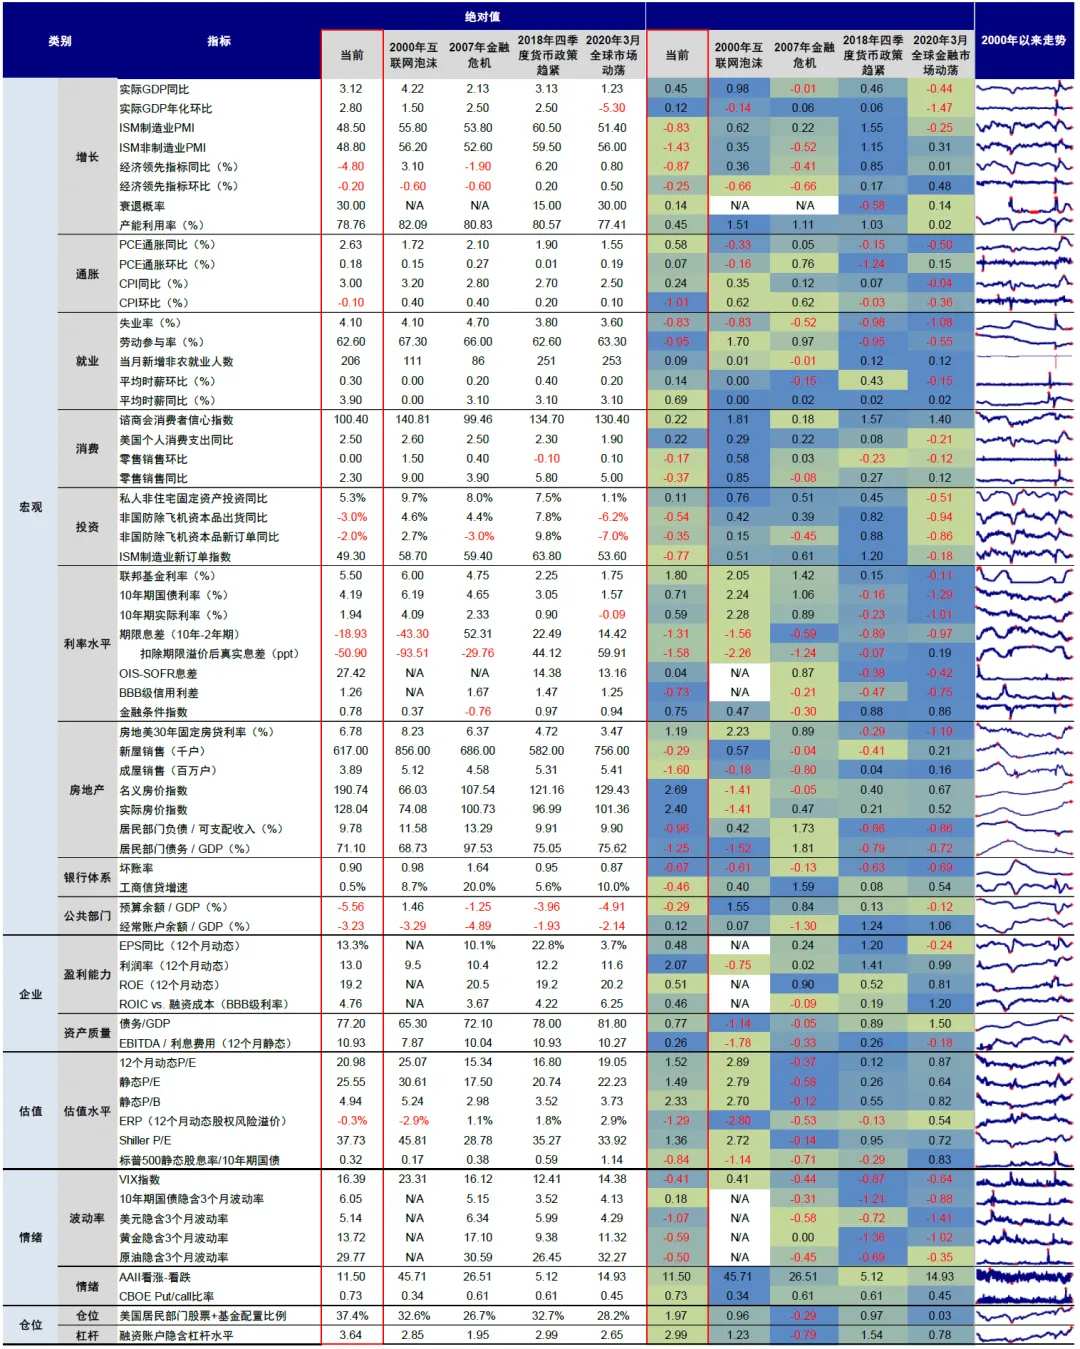
As to whether there is a risk of a bear market in US stocks, we think the current pressure is limited; it is more comparable to 2018. Based on the index system we constructed in “Looking at the Bear Market Index System, US Stocks Shine a Few “Red Lights”. Comparing the 2000 tech bubble, the 2008 financial crisis, and the profit inflection point in the fourth quarter of 2018, the 2020 pandemic impacted when these rounds of bear market cycles began, we found that: 1) Fundamental expectations have slowed, and the magnitude is closer to the situation before interest rate cuts after the 2018 rate hike; it is not a crisis situation. Current growth expectations are weakening, as are leading economic indicators (LEI Index) and PMI. Interest rate sensitive sectors such as investment and real estate are at the bottom of the cycle, and consumption is also slowing down. However, against the backdrop of this round of “rolling” slowdown, the current probability of a recession is only 30%, and the pressure on residents' debt, the pressure on corporate sector profits and interest payments, and the level of bad debt in the banking system are all very different from the crisis period. 2) The valuation index is higher than in 2018, but it hasn't reached 2000 yet. The level of dynamic PE and Shiller PE in US stocks is higher than at the end of 2018, but there is still a big gap compared to the 2000 tech bubble. The dividend rate/treasury bond interest rate, which measures the cost performance of equity assets, is far better than in 2000. 3) This round of trading is highly concentrated, and the volatility is greater than the 2018 level. Both bullish sentiment indicators and market volatility are currently above the level at the end of 2018, but still below the level of 2000.
Chart: Based on the index system we built, comparing the situation before the start of the bear cycle of the 2000 tech bubble, the 2008 financial crisis, the tightening of monetary policy in the fourth quarter of 2018, and the impact of the 2020 pandemic, we found that 2018 may be more comparable
5. Future trends and market positions? The pullback provides a better opportunity for intervention. The early denominator is flexible but treated with caution, and after cashing out, it shifts to beneficial assets for molecules
Our benchmark assumes a slowdown in US growth, but not a recession. Precisely for this reason, those denominator transactions that simply rely on interest rate cuts cannot be extrapolated excessively; instead, when interest rate cuts are realized, such transactions should “fight back and forth.” In contrast, pricing is more biased towards fractional risk assets, which themselves tend to weaken before and after interest rate cuts. As we described above in 2019, the pullback also provides better opportunities for intervention.
► For major asset classes, the pullback in risky assets provided a better opportunity for the Federal Reserve to cut interest rates. Therefore, it is still possible to participate in interest rate cut transactions that benefit from easing, but due to asset scrambling, easing is already halfway through. Assets that only benefit from improved liquidity on the denominator side of interest rate cuts, but have no other beneficiary logic, need to “fight and retreat,” such as US debt, gold, and small-cap stocks that lack profit support. An asset that cuts interest rates while solving numerator and denominator issues would be better. After interest rate cuts, they benefited from rising demand brought about by falling financing costs, thereby improving profitable assets on the molecular side, and the relative allocation value increased. When the interest rate cut is realized, it may also be the end of the interest rate cut transaction, gradually turning to assets benefiting from re-inflation, such as US stocks and commodities such as copper and oil.
Chart: The pullback instead provides an opportunity to intervene in interest rate cut transactions. Currently, more than half of the easing transactions have yet to be completed, and the inflation deal has not yet been completed
► We are generally not pessimistic about US stocks, so “if they fall too much, we can buy them back.” According to our financial liquidity model and US stock valuation profit model, the S&P 500 index pullback pressure point is around 4,900 to 5100 points, and the short-term technical support level is 5,300. Along with the Federal Reserve's interest rate cut expectations and financial liquidity recovery, we expect a recovery to the S&P 500 index level of 5,500 points. Technology stocks pulled back more or more. The NASDAQ pullback pressure point was around 16200 to 16,900 points, and the short-term support level was 17,000. It is also expected to reap positive returns at the beginning of the year. In the sector, small-market growth, which benefited from liquidity in the early stages, was relatively superior, but “fight and retreat”; technology leaders and pro-cyclical leaders who also benefited from the molecular denominator in the later stages had an advantage. This was true in combination with general elections and interest rate cut transactions
Chart: According to our financial liquidity model and US stock valuation profit model, the S&P 500 index pullback pressure point is around 4,900 to 5100 points, and the short-term technical support level is 5,300. It is still expected that all lost ground will be repaired at the beginning of next year
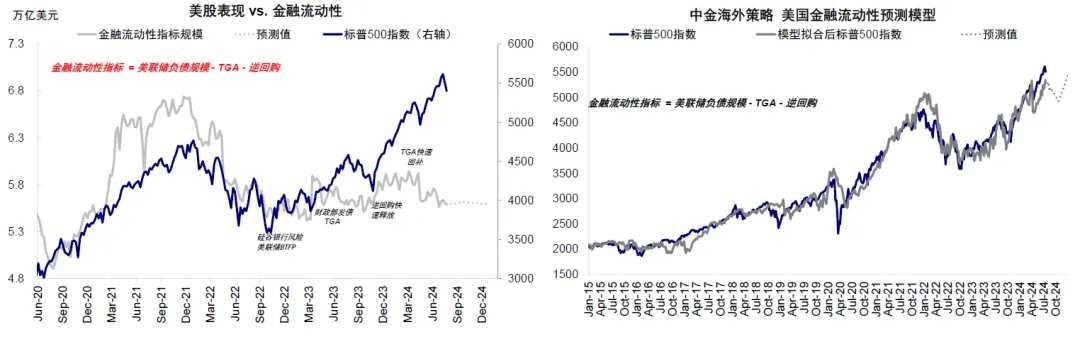
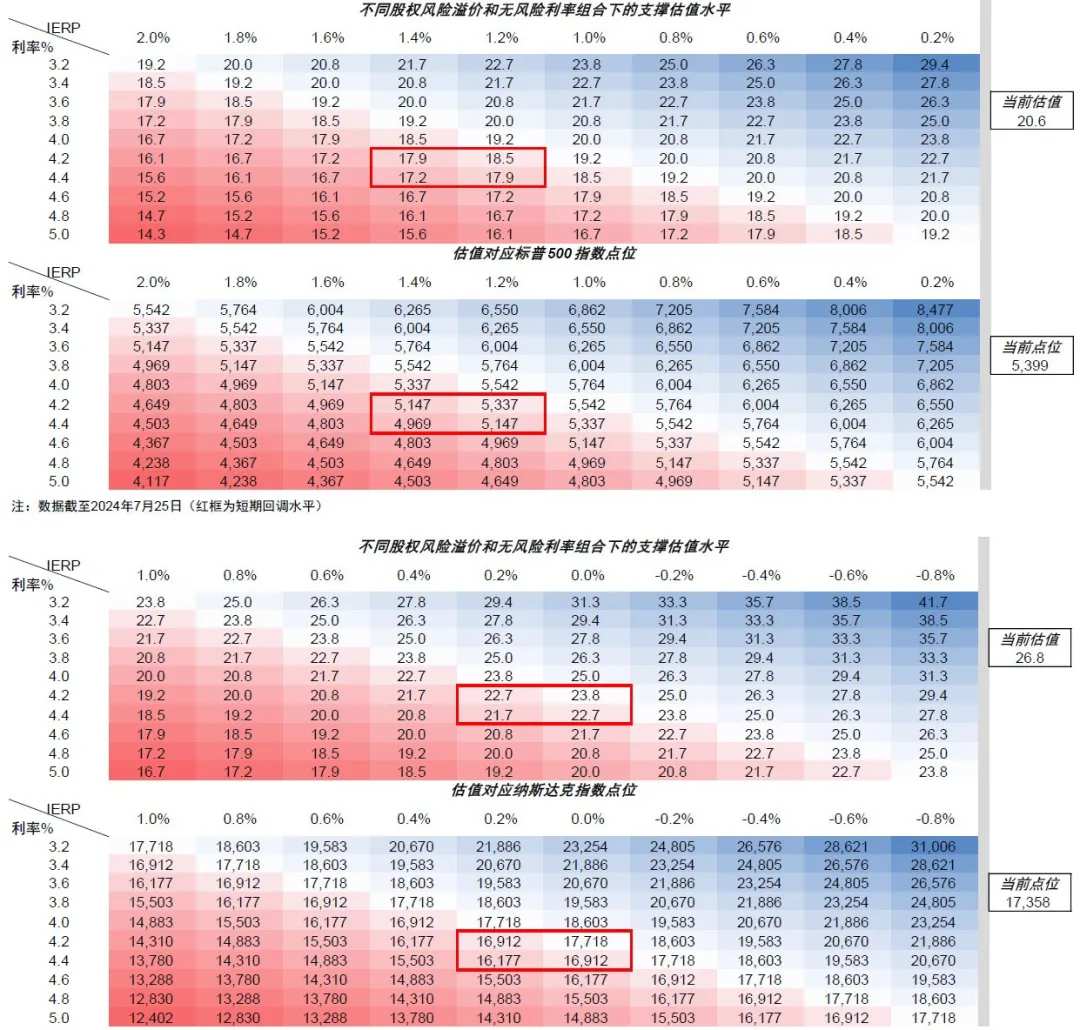
Chart: S&P 500 and Nasdaq Index sensitivity tests
Editor/Jeffrey