
#Gold Technical Analysis# 24K99 News: In the Asian market on Friday (July 26th), spot gold suddenly soared, with a short-term increase of nearly $20. The current gold price has exceeded $2370/ounce. FXStreet analyst Haresh Menghani wrote the latest article on Friday, analyzing the technical trend of gold price. Menghani pointed out that due to the optimistic macroeconomic data released by the United States on Thursday, the gold price plummeted to a two-week low. However, as the US dollar weakens again, the price of gold rebounds from the two-week low. The bet on the Fed's rate cut in September has put the dollar bulls on hold and helped limit the downward trend of gold prices. The US dollar index is currently around 104.25, down 0.1% in a day. Spot gold plummeted $32.61 on Thursday, or 1.36%, to $2364.25/ounce. Menghani said that gold traders are currently more willing to wait for the release of the US PCE price index before making directional bets. This critical inflation data will play a key role in determining the Fed's policy path, which in turn will drive the trend of the dollar and gold. From a technical perspective, Menghani pointed out that on Friday, the gold price showed some elasticity below the 50-day simple moving average (SMA) for the second consecutive day, and it looks like it has ended its two consecutive days of decline. However, the oscillation indicator on the daily chart has just begun to gain negative traction, which indicates that the minimum resistance path for gold is downward. Menghani said that any further recovery in gold prices may attract new sellers near $2380/ounce. The next obstacle is near $2391-2392/ounce, followed by the key level of $2400/ounce. If the gold price breaks through the key level of $2400/ounce, it may trigger a new round of short-covering and push the gold price up to the weekly high of $2432/ounce. On the other hand, if the gold price falls below the 50-day moving average and the support level of $2350/ounce, it will be regarded as a new detonator by bearish traders. At that time, the gold price may challenge the 100-day moving average (currently around the $2325-2324/ounce area). The above range should be a key level. If it is lost, it will pave the way for gold prices to fall below $2300/ounce or the June low.
Spot gold rebounded sharply from the intraday low of $2355.77/ounce and currently reached the highest point of $2374.17/ounce.
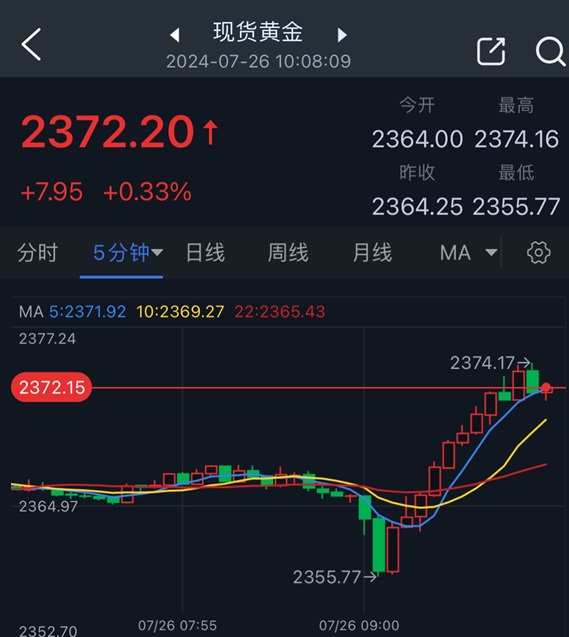
(Spot gold 5-minute chart Source: 24K99)
Menghani pointed out that the price of gold fell sharply to a two-week low due to the optimistic macroeconomic data released by the United States on Thursday. However, as the US dollar weakens again, the gold price rebounds from the two-week low. The bet on the Fed's rate cut in September has put the dollar bulls on hold and helped limit the downward trend of gold prices.
The US dollar index is currently around 104.25, down 0.1% in a day.
The U.S. Bureau of Economic Analysis on Thursday released a report showing that U.S. real gross domestic product (GDP) in the second quarter of the year increased at an annualized rate of 2.8% on a seasonally adjusted quarterly basis, higher than the expected value of 2% and the previous value of 1.4%.
Spot gold plummeted $32.61 on Thursday, or 1.36%, to $2364.25/ounce.
Menghani said that gold traders are currently more willing to wait for the release of the US PCE price index before making directional bets. This critical inflation data will play a key role in determining the Fed's policy path, which in turn will drive the trend of the dollar and gold.
At 20:30 on Friday Beijing time, U.S. June personal consumption expenditure (PCE) price data will be released, which may reveal the Fed's interest rate path.
Authoritative media surveys show that the U.S. June PCE price index is expected to rise by 0.1% on a monthly basis, compared with no change in May. The U.S. June PCE price index is expected to increase by 2.5% on an annual basis, compared with a growth of 2.6% in May.
On a more crucial core data front, the survey shows that the U.S. June core PCE price index is expected to rise by 0.1% on a monthly basis, compared with a rise of 0.1% in May; the U.S. June core PCE price index is expected to climb 2.5% on an annual basis, up from a rise of 2.6%.
As the most favored inflation indicator of the Fed, the year-on-year change of core PCE price index has a greater impact on policy makers.
The latest gold trading analysis
Menghani pointed out that from a technical point of view, on Friday, gold price showed some resilience below the 50-day simple moving average (SMA) for the second consecutive day. It looks like it has ended the two consecutive days of decline. However, the oscillation indicator on the daily chart has just begun to gain negative traction, which indicates that the minimum resistance path for gold is downward.
Menghani said that any further recovery in gold prices may attract new sellers near $2380/ounce. The next obstacle is near $2391-2392/ounce, followed by the key level of $2400/ounce.
If the gold price breaks through the key level of $2400/ounce, it may trigger a new round of short-covering and push the gold price up to the weekly high of $2432/ounce.
Menghani added that if the gold price falls below the 50-day moving average and the support level of $2350/ounce, it will be regarded as a new detonator by bearish traders. At that time, the gold price may challenge the 100-day moving average (currently around the $2325-2324/ounce area). The above range should be a key level. If it is lost, it will pave the way for gold prices to fall below $2300/ounce or the June low.
The above range should be a key level. If it is lost, it will pave the way for gold prices to fall below $2300/ounce or the June low.
At 10:08 Beijing time, spot gold was reported at $2372.20/ounce.