
In early European trading on Thursday, spot gold maintained its intraday decline, currently trading around $2372/ounce, down nearly $25 on the day. On this trading day, gold traders will focus on US GDP data, which is expected to trigger another wave of big moves in the gold market.
FXStreet senior analyst Dhwani Mehta pointed out that the price of gold fell sharply on Thursday, and the price of gold may challenge the key support level of $2360/ounce.
Spot gold closed down 0.51% at $2396.86 an ounce on Wednesday. On Thursday in early European trading, gold fell to around $2365 an ounce.
At 20:30 p.m. on Thursday Beijing time, the initial estimate of the actual GDP for the second quarter of the United States will be released, with an expected annualized quarterly growth rate of 2.0%, up from a growth rate of 1.4% in the previous quarter.
Mehta wrote that now people's attention has turned to the upcoming US GDP data for the second quarter. Weak data could reinforce expectations that the Fed will cut interest rates twice this year. The CME Group's "FedWatch Tool" shows that the market has fully priced in the rate cut expectations for September.
Mehta said that before the release of the monthly personal consumption expenditure (PCE) data on Friday, the quarterly PCE inflation data will also attract market attention.
The latest gold trading analysis
Mehta pointed out that with the relative strength index (RSI) falling below the 50 level on the 14th, the trend has turned in favor of gold sellers.
The price of gold failed to hold above the $2425/ounce level, and a new round of downward trend followed. As gold prices fell below the $2400/ounce mark, the selling pressure accelerated.
Mehta said that if the price of gold cannot hold above the 50-day moving average of $2360/ounce, the price of gold will accelerate towards the 100-day moving average support level of $2322/ounce. Before that, the psychological level of $2350/ounce may save gold buyers.
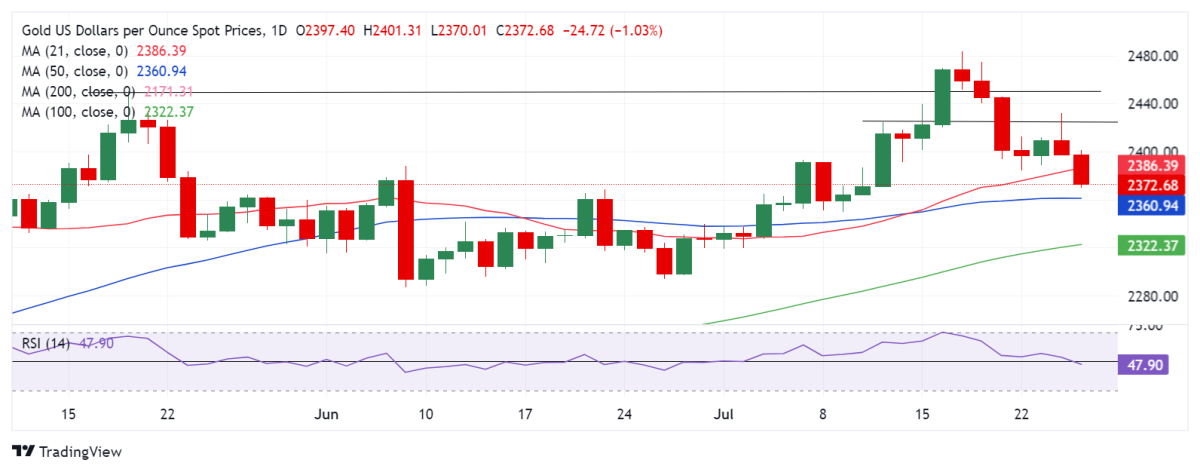
(Spot gold daily chart source: FXStreet)
On the other hand, Mehta added that the short-term resistance level for the price of gold is at the 21-day moving average of $2386/ounce; if it breaks through this level, the price of gold may retest the key level of $2400/ounce.
The next upside target for the price of gold is at the area of $2412/ounce and the static resistance level of $2425/ounce.
At 15:26 Beijing time, spot gold was trading at $2372.25 an ounce.