
#Gold Technical Analysis# On Wednesday (July 24th) during the New York trading period to the early Asian market on Thursday, spot gold saw a sharp drop of nearly 40 US dollars, and now the gold price has dropped below 2,400 US dollars/ounce.
Due to the weak US dollar and the market's complete pricing of the Federal Reserve's interest rate cut in September, spot gold briefly broke through the $2,430/ounce mark on Wednesday, but later fell back due to profit-taking by traders and factors such as rising US bond yields, ultimately falling 0.51% to $2,396.86/ounce.
Gold price experienced a sudden drop of nearly $40.
During the New York trading session on Wednesday, spot gold rose sharply to $2,432.03/ounce, reaching an intraday high. However, the gold price quickly plummeted afterwards.
At the beginning of the Asian market on Thursday, spot gold further fell to $2,392.95/ounce, a drop of nearly $40 from the overnight high.
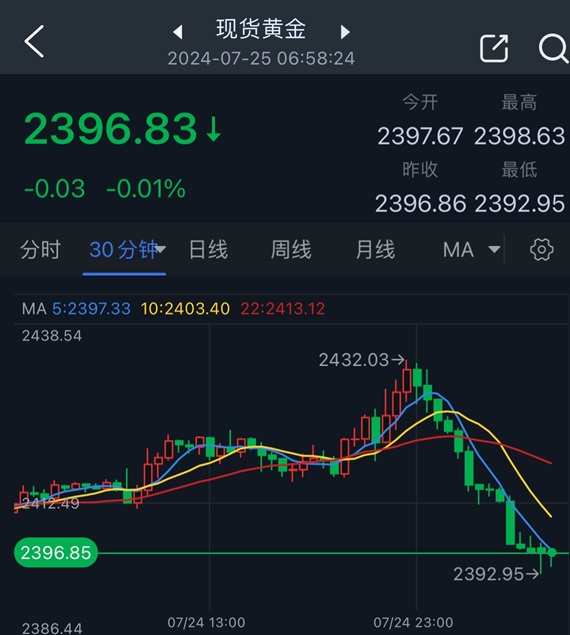
(Spot gold 30-minute chart, source: 24K99)
FXStreet analyst Christian Borjon Valencia pointed out that gold price touched $2,432/ounce in the middle of Wednesday's trading, and the probability of a 25 basis point interest rate cut by the Fed in September, which was predicted by the "Fed Watch Tool", was 100%, which boosted gold prices.
Valencia added that the gold price then quickly retreated and plunged below $2,400/ounce. The yield for U.S. 10-year treasury notes rose two basis points to 4.274%, which is a negative factor for gold.
Gold traders are currently awaiting the release of U.S. Q2 GDP data on Thursday and the latest Personal Consumption Expenditures (PCE) Price Index on Friday, as this is the preferred inflation indicator for the Federal Reserve.
How to trade after the deep correction of gold prices?
Valencia said that gold prices touched a three-day high above $2,430/ounce on Wednesday, but has fallen below the July 23 high of $2,412/ounce, indicating a lack of buying power. The daily closing price below the latter may further pressure gold for selling. However, U.S. data will drive gold prices on Thursday and Friday.
The relative strength index (RSI) still indicates a bullish trend, but the slope has flattened, indicating a lack of direction between buyers and sellers.
Valencia pointed out that on the downside, if gold prices fall heavily below the July 22 low of $2,384/ounce, a deeper correction may occur. The next support level for gold price would be the 50-day simple moving average (SMA) of $2,359/ounce.
Once gold sellers push the gold price effectively below the 100-day moving average of $2,315/ounce, the gold price is expected to fall further to $2,300/ounce.
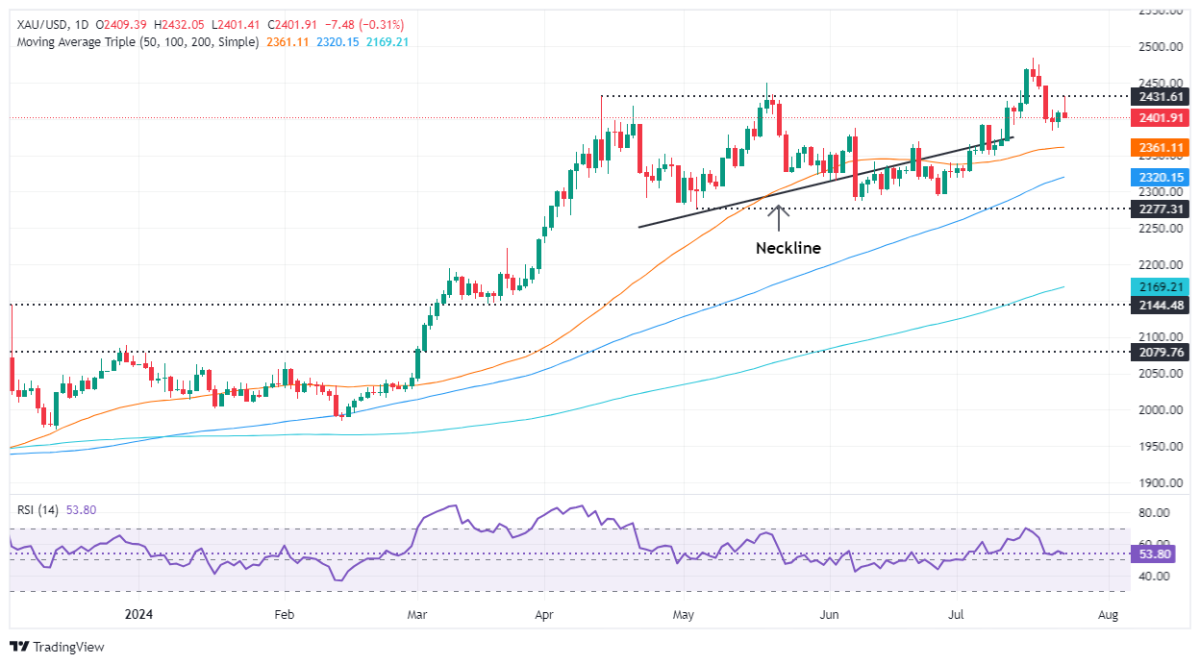
(Spot gold daily chart source: FXStreet)
On the upside, Valencia added that for continue bullishness, gold prices need to break through the Wednesday high of $2,430/ounce. Once broken, the next resistance level for gold price would be $2,450/ounce, and then challenge the historical high of $2,483/ounce. Finally, the gold price will aim at the $2,500/ounce mark.