
John B. Sanfilippo & Son (NASDAQ:JBSS) has had a great run on the share market with its stock up by a significant 5.7% over the last week. Since the market usually pay for a company's long-term fundamentals, we decided to study the company's key performance indicators to see if they could be influencing the market. Specifically, we decided to study John B. Sanfilippo & Son's ROE in this article.
Return on equity or ROE is a key measure used to assess how efficiently a company's management is utilizing the company's capital. In simpler terms, it measures the profitability of a company in relation to shareholder's equity.
How To Calculate Return On Equity?
Return on equity can be calculated by using the formula:
Return on Equity = Net Profit (from continuing operations) ÷ Shareholders' Equity
So, based on the above formula, the ROE for John B. Sanfilippo & Son is:
20% = US$65m ÷ US$322m (Based on the trailing twelve months to March 2024).
The 'return' is the amount earned after tax over the last twelve months. That means that for every $1 worth of shareholders' equity, the company generated $0.20 in profit.
What Is The Relationship Between ROE And Earnings Growth?
So far, we've learned that ROE is a measure of a company's profitability. Depending on how much of these profits the company reinvests or "retains", and how effectively it does so, we are then able to assess a company's earnings growth potential. Assuming everything else remains unchanged, the higher the ROE and profit retention, the higher the growth rate of a company compared to companies that don't necessarily bear these characteristics.
John B. Sanfilippo & Son's Earnings Growth And 20% ROE
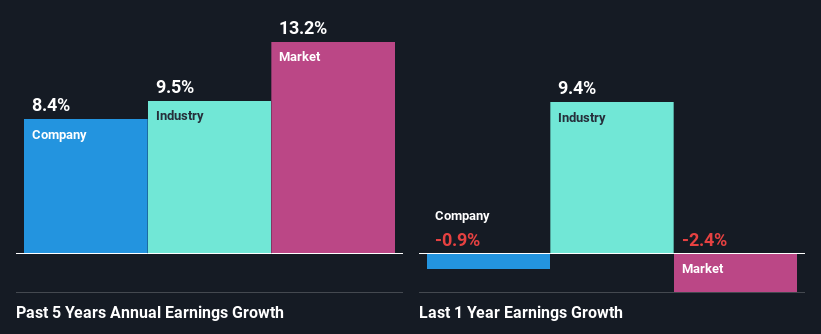
To start with, John B. Sanfilippo & Son's ROE looks acceptable. On comparing with the average industry ROE of 14% the company's ROE looks pretty remarkable. This certainly adds some context to John B. Sanfilippo & Son's decent 8.4% net income growth seen over the past five years.
As a next step, we compared John B. Sanfilippo & Son's net income growth with the industry and found that the company has a similar growth figure when compared with the industry average growth rate of 9.5% in the same period.
Earnings growth is an important metric to consider when valuing a stock. What investors need to determine next is if the expected earnings growth, or the lack of it, is already built into the share price. By doing so, they will have an idea if the stock is headed into clear blue waters or if swampy waters await. Is John B. Sanfilippo & Son fairly valued compared to other companies? These 3 valuation measures might help you decide.
Is John B. Sanfilippo & Son Efficiently Re-investing Its Profits?
John B. Sanfilippo & Son has a low three-year median payout ratio of 14%, meaning that the company retains the remaining 86% of its profits. This suggests that the management is reinvesting most of the profits to grow the business.
Moreover, John B. Sanfilippo & Son is determined to keep sharing its profits with shareholders which we infer from its long history of paying a dividend for at least ten years.
Conclusion
On the whole, we feel that John B. Sanfilippo & Son's performance has been quite good. Specifically, we like that the company is reinvesting a huge chunk of its profits at a high rate of return. This of course has caused the company to see substantial growth in its earnings. If the company continues to grow its earnings the way it has, that could have a positive impact on its share price given how earnings per share influence long-term share prices. Remember, the price of a stock is also dependent on the perceived risk. Therefore investors must keep themselves informed about the risks involved before investing in any company. To know the 1 risk we have identified for John B. Sanfilippo & Son visit our risks dashboard for free.
Have feedback on this article? Concerned about the content? Get in touch with us directly. Alternatively, email editorial-team (at) simplywallst.com.
This article by Simply Wall St is general in nature. We provide commentary based on historical data and analyst forecasts only using an unbiased methodology and our articles are not intended to be financial advice. It does not constitute a recommendation to buy or sell any stock, and does not take account of your objectives, or your financial situation. We aim to bring you long-term focused analysis driven by fundamental data. Note that our analysis may not factor in the latest price-sensitive company announcements or qualitative material. Simply Wall St has no position in any stocks mentioned.
Have feedback on this article? Concerned about the content? Get in touch with us directly. Alternatively, email editorial-team@simplywallst.com