
#Gold Technical Analysis# 24K99 News On Tuesday (July 16th), in early European trading, spot gold continued its intraday rally and rose above $2437 per ounce, surging $15 during the day. Dhwani Mehta, a senior analyst at FXStreet, has written a latest article analyzing the technical trends of gold.
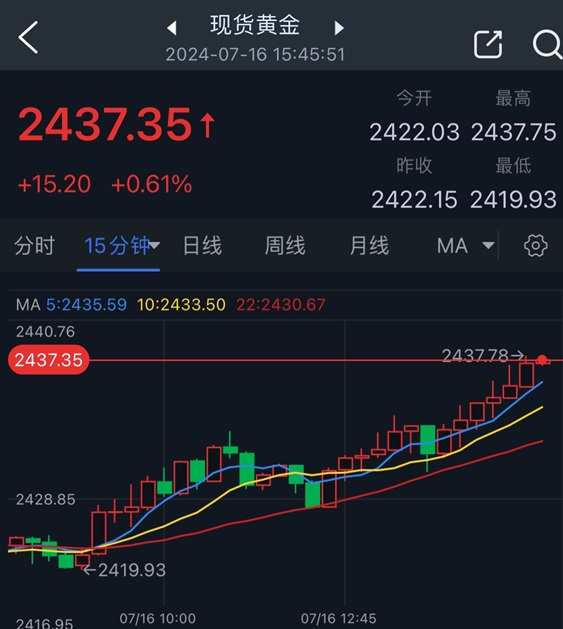
(Source: 24K99) 15-minute chart for spot gold.
Mehta wrote that on Tuesday morning, the price of gold is expected to continue its previous upward trend. Yesterday, the price of gold had reached a two-month high of $2440 per ounce. Expectations for the Fed to cut interest rates in September have been increasingly supporting the price of gold. Due to favorable technical factors and increased betting on a Fed rate cut in September, the price of gold may reach $2450 per ounce again.
Spot gold rose $12.67 on Monday, up 0.53%, to $2422.15 per ounce.
Federal Reserve Chairman Powell said on Monday that second-quarter economic data have given policymakers greater confidence that inflation is falling toward the Fed's 2% target. His comments may pave the way for recent interest rate cuts. After Powell made dovish comments, spot gold prices soared to $2439.79 per ounce in the New York session on Monday.
Mehta pointed out that later on Tuesday, the US retail sales report and speeches by Federal Reserve officials will attract people's attention. Weaker-than-expected US retail sales data could strengthen the selling of the US dollar and push up the price of gold.
At 8:30 pm Beijing time on Tuesday, the US Census Bureau will release retail sales data for June. Economists expect that US retail sales in June will remain flat, after growth of 0.1% in May.
US retail sales data are commonly known as "Terrible Data" because they usually have a significant impact on financial markets, which may affect the trends of assets such as the US dollar and gold.
Gold Technical Analysis
Mehta said that looking at the daily chart of gold, the relative strength index (RSI) on the 14th day is bullish, currently approaching 65, and the target price of gold is still the historical high of $2450 per ounce.
On Friday, the 21-day simple moving average (SMA) closed above the 50-day moving average, forming a bullish crossover, which increases the credibility of the bullish potential.
Mehta said that gold buyers need the daily closing price to be above the previous two-month high of $2425 per ounce to challenge the record high of $2450 per ounce. Before that, the two-month high of $2440 per ounce may challenge the commitment of the shorts.
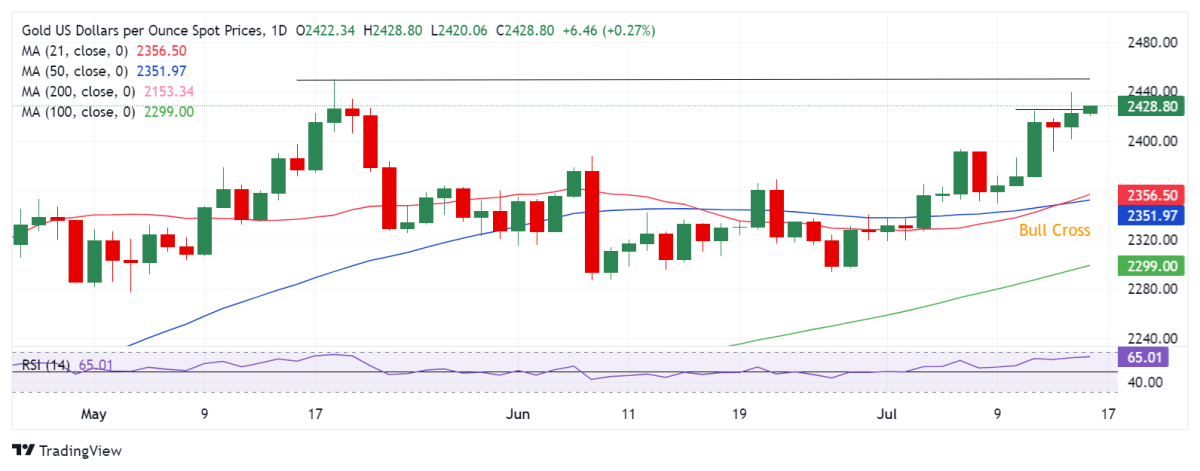
(Spot gold daily chart source: FXStreet)
On the other hand, Mehta added that any pullback in gold prices could lead to a test of $2400 per ounce. Once it falls below this level, the low of $2391 per ounce on last Friday may be tested.
Afterwards, the next support level for the price of gold will be at the low of $2371 per ounce on July 11th and the psychological level of $2350 per ounce.
At 3:45 pm Beijing time, spot gold was quoted at $2437.35 per ounce.