
#Gold Technical Analysis# 24K99 News On Tuesday (July 16), spot gold rose in the short term in the Asian market, and the gold price is currently approaching the $2,430/ounce mark. Valeria Bednarik, chief analyst at FXStreet, wrote an analysis of the technical prospects for gold.
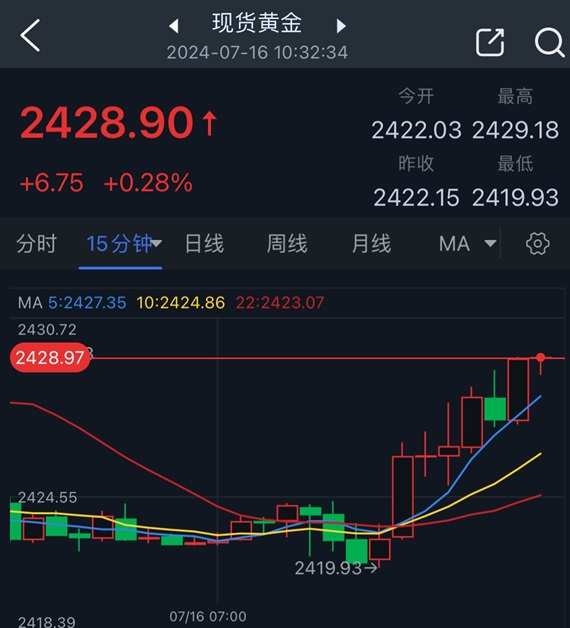
(Source: 24K99) 15-minute chart for spot gold.
Bednarik pointed out that Fed Chairman Powell expressed dovish tendencies on Monday. The reason for being bullish on gold has been strengthened, with a target of retesting the historical high of $2,450/ounce.
Fed Chairman Powell released a dovish signal on Monday. Powell stated that the economic data in the second quarter has given policymakers more confidence that inflation is falling to the Fed's 2% target. These remarks may pave the way for interest rate cuts in the near future.
Powell said that interest rates will not be cut until inflation reaches the 2% target, because the impact of monetary policy has a lag effect. If interest rates are kept too high for too long, it will over-inhibit economic growth. He further explained that if interest rates are cut when inflation reaches the 2% target, it may take too long because tight monetary policy is currently being implemented, or existing tight policies will continue to have an impact, which will push inflation below 2%.
Spot gold closed up $12.67 on Monday, up 0.53%, to $2,422.15/ounce. After Powell's speech, spot gold prices soared to $2,439.79/ounce.
Jim Wyckoff, senior market analyst at Kitco Metals, said: "The trend of gold prices will continue to rise horizontally, and it will not surprise me if a new record high is set in the next few weeks or even shorter periods of time."
Spot gold reached a historical high of $2,449.89/ounce on May 20th.
Short-term technical outlook for gold
Bednarik said that from a technical perspective, during the midday of the US time on Monday, the gold price fell back from the intraday high, but the daily chart still shows an active bullish situation. The gold price has rebounded to a level far above the bullish moving average line; technical indicators have gained upward momentum, approached overbought, and there is no sign of giving up.
Bednarik added that from the 4-hour trend chart, the recent gold price may be difficult to continue to rise. Technical indicators are falling back from overbought readings, but the strength is uneven and it still does not indicate that a decline is imminent. Nevertheless, the gold price is still developing above the bullish 20-period simple moving average (SMA), which is currently around $2,403/ounce; while the longer-term moving average is slowly gaining upward momentum, but far lower than the 20-period SMA.
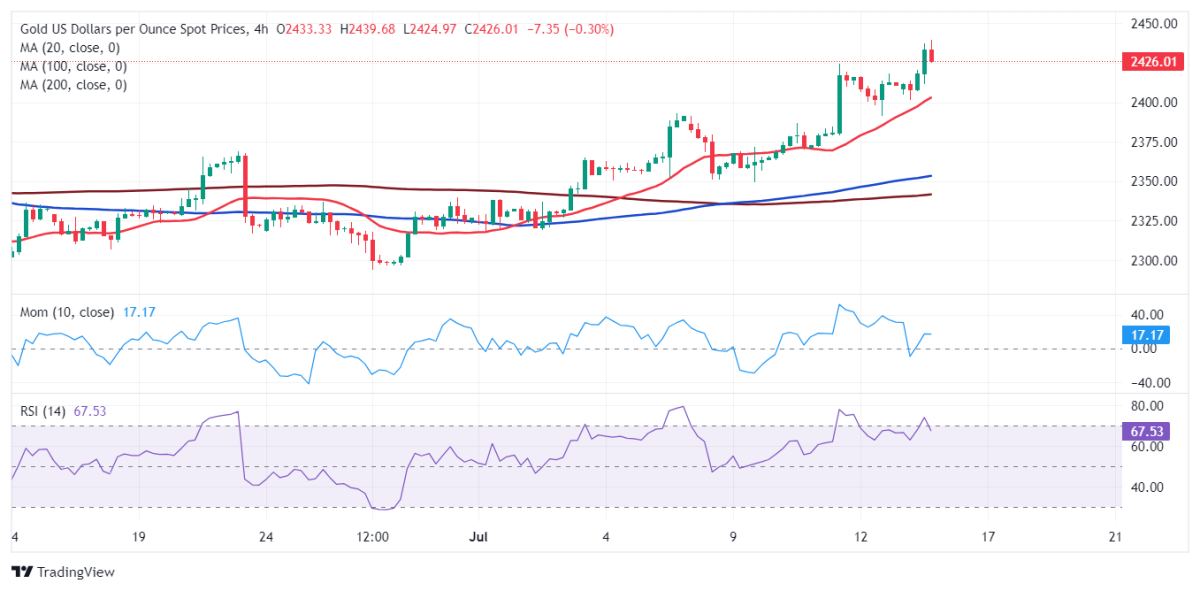
(Spot gold 4-hour chart source: FXStreet)
Bednarik gave the latest important support and resistance levels for the gold price:
Resistance levels: $2,439.60/ounce; $2,450.00/ounce; $2,465.00/ounce
Support levels: $2,418.10/ounce; $2,403.00/ounce; $2,391.20/ounce
At 10:32 Beijing time, spot gold was reported at $2,428.90/ounce.