
In order to justify the effort of selecting individual stocks, it's worth striving to beat the returns from a market index fund. But the main game is to find enough winners to more than offset the losers So we wouldn't blame long term Franklin Resources, Inc. (NYSE:BEN) shareholders for doubting their decision to hold, with the stock down 35% over a half decade.
Since shareholders are down over the longer term, lets look at the underlying fundamentals over the that time and see if they've been consistent with returns.
To quote Buffett, 'Ships will sail around the world but the Flat Earth Society will flourish. There will continue to be wide discrepancies between price and value in the marketplace...' One imperfect but simple way to consider how the market perception of a company has shifted is to compare the change in the earnings per share (EPS) with the share price movement.
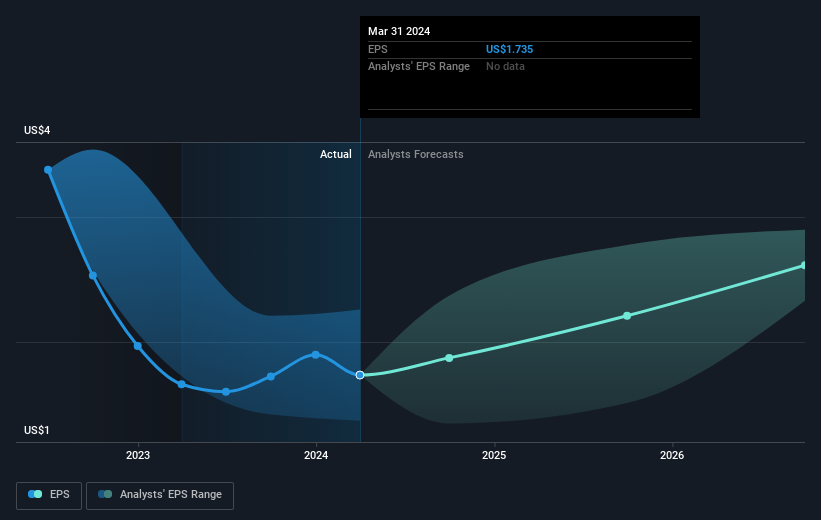
During the five years over which the share price declined, Franklin Resources' earnings per share (EPS) dropped by 11% each year. This fall in the EPS is worse than the 8% compound annual share price fall. The relatively muted share price reaction might be because the market expects the business to turn around.
The image below shows how EPS has tracked over time (if you click on the image you can see greater detail).
It's probably worth noting we've seen significant insider buying in the last quarter, which we consider a positive. On the other hand, we think the revenue and earnings trends are much more meaningful measures of the business. Dive deeper into the earnings by checking this interactive graph of Franklin Resources' earnings, revenue and cash flow.
What About Dividends?
It is important to consider the total shareholder return, as well as the share price return, for any given stock. Whereas the share price return only reflects the change in the share price, the TSR includes the value of dividends (assuming they were reinvested) and the benefit of any discounted capital raising or spin-off. So for companies that pay a generous dividend, the TSR is often a lot higher than the share price return. We note that for Franklin Resources the TSR over the last 5 years was -18%, which is better than the share price return mentioned above. This is largely a result of its dividend payments!
A Different Perspective
Franklin Resources shareholders are down 17% for the year (even including dividends), but the market itself is up 24%. However, keep in mind that even the best stocks will sometimes underperform the market over a twelve month period. Unfortunately, last year's performance may indicate unresolved challenges, given that it was worse than the annualised loss of 3% over the last half decade. Generally speaking long term share price weakness can be a bad sign, though contrarian investors might want to research the stock in hope of a turnaround. It's always interesting to track share price performance over the longer term. But to understand Franklin Resources better, we need to consider many other factors. For instance, we've identified 3 warning signs for Franklin Resources that you should be aware of.
If you like to buy stocks alongside management, then you might just love this free list of companies. (Hint: most of them are flying under the radar).
Please note, the market returns quoted in this article reflect the market weighted average returns of stocks that currently trade on American exchanges.
Have feedback on this article? Concerned about the content? Get in touch with us directly. Alternatively, email editorial-team (at) simplywallst.com.
This article by Simply Wall St is general in nature. We provide commentary based on historical data and analyst forecasts only using an unbiased methodology and our articles are not intended to be financial advice. It does not constitute a recommendation to buy or sell any stock, and does not take account of your objectives, or your financial situation. We aim to bring you long-term focused analysis driven by fundamental data. Note that our analysis may not factor in the latest price-sensitive company announcements or qualitative material. Simply Wall St has no position in any stocks mentioned.
Have feedback on this article? Concerned about the content? Get in touch with us directly. Alternatively, email editorial-team@simplywallst.com