
With its stock down 8.1% over the past three months, it is easy to disregard Exxon Mobil (NYSE:XOM). However, a closer look at its sound financials might cause you to think again. Given that fundamentals usually drive long-term market outcomes, the company is worth looking at. Specifically, we decided to study Exxon Mobil's ROE in this article.
Return on Equity or ROE is a test of how effectively a company is growing its value and managing investors' money. In other words, it is a profitability ratio which measures the rate of return on the capital provided by the company's shareholders.
How Is ROE Calculated?
The formula for ROE is:
Return on Equity = Net Profit (from continuing operations) ÷ Shareholders' Equity
So, based on the above formula, the ROE for Exxon Mobil is:
16% = US$34b ÷ US$213b (Based on the trailing twelve months to March 2024).
The 'return' is the yearly profit. That means that for every $1 worth of shareholders' equity, the company generated $0.16 in profit.
What Is The Relationship Between ROE And Earnings Growth?
Thus far, we have learned that ROE measures how efficiently a company is generating its profits. Based on how much of its profits the company chooses to reinvest or "retain", we are then able to evaluate a company's future ability to generate profits. Assuming everything else remains unchanged, the higher the ROE and profit retention, the higher the growth rate of a company compared to companies that don't necessarily bear these characteristics.
Exxon Mobil's Earnings Growth And 16% ROE
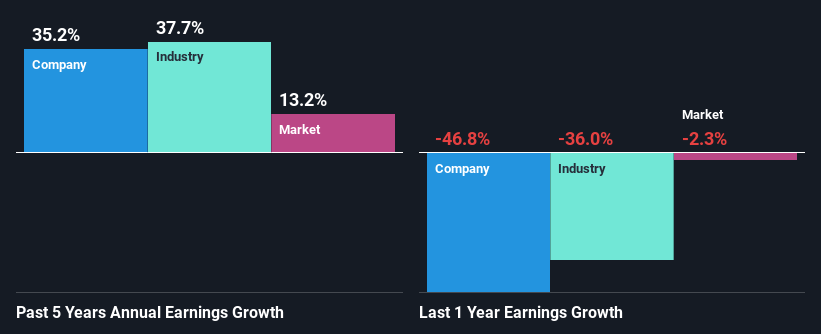
To begin with, Exxon Mobil seems to have a respectable ROE. Further, the company's ROE is similar to the industry average of 18%. This probably goes some way in explaining Exxon Mobil's significant 35% net income growth over the past five years amongst other factors. We believe that there might also be other aspects that are positively influencing the company's earnings growth. Such as - high earnings retention or an efficient management in place.
We then performed a comparison between Exxon Mobil's net income growth with the industry, which revealed that the company's growth is similar to the average industry growth of 38% in the same 5-year period.
Earnings growth is an important metric to consider when valuing a stock. It's important for an investor to know whether the market has priced in the company's expected earnings growth (or decline). By doing so, they will have an idea if the stock is headed into clear blue waters or if swampy waters await. Has the market priced in the future outlook for XOM? You can find out in our latest intrinsic value infographic research report.
Is Exxon Mobil Using Its Retained Earnings Effectively?
Exxon Mobil's three-year median payout ratio is a pretty moderate 29%, meaning the company retains 71% of its income. This suggests that its dividend is well covered, and given the high growth we discussed above, it looks like Exxon Mobil is reinvesting its earnings efficiently.
Besides, Exxon Mobil has been paying dividends for at least ten years or more. This shows that the company is committed to sharing profits with its shareholders. Looking at the current analyst consensus data, we can see that the company's future payout ratio is expected to rise to 43% over the next three years. However, the company's ROE is not expected to change by much despite the higher expected payout ratio.
Summary
On the whole, we feel that Exxon Mobil's performance has been quite good. In particular, it's great to see that the company is investing heavily into its business and along with a high rate of return, that has resulted in a sizeable growth in its earnings. That being so, a study of the latest analyst forecasts show that the company is expected to see a slowdown in its future earnings growth. To know more about the company's future earnings growth forecasts take a look at this free report on analyst forecasts for the company to find out more.
Have feedback on this article? Concerned about the content? Get in touch with us directly. Alternatively, email editorial-team (at) simplywallst.com.
This article by Simply Wall St is general in nature. We provide commentary based on historical data and analyst forecasts only using an unbiased methodology and our articles are not intended to be financial advice. It does not constitute a recommendation to buy or sell any stock, and does not take account of your objectives, or your financial situation. We aim to bring you long-term focused analysis driven by fundamental data. Note that our analysis may not factor in the latest price-sensitive company announcements or qualitative material. Simply Wall St has no position in any stocks mentioned.
Have feedback on this article? Concerned about the content? Get in touch with us directly. Alternatively, email editorial-team@simplywallst.com