
Bit Digital, Inc. (NASDAQ:BTBT), a company engaged in bitcoin mining and various digital asset activities, has recently shown signs of a significant bullish technical pattern known as the 'Golden Cross.'
Despite a challenging year with Bit Digital's stock down 13.03% over the past year and 17.97% year-to-date, the recent technical indicators suggest a potential upside ahead.
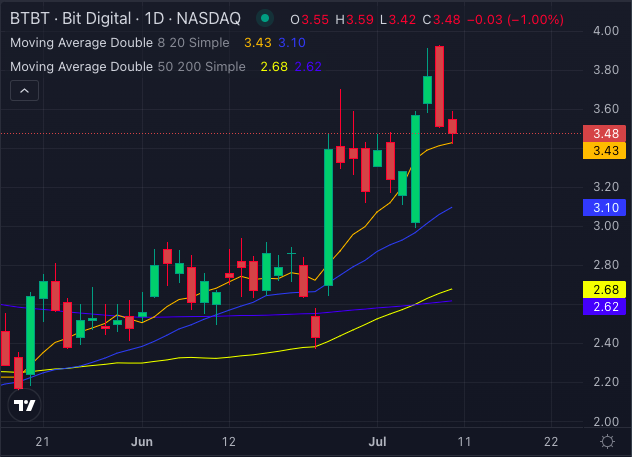
Chart created using Benzinga Pro
- Moving Averages and Golden Cross:
- 8-day SMA: BTBT share price is $3.48, above the 8-day simple moving average of $3.43, signaling bullish momentum.
- 20-day SMA: The stock price is also above the 20-day SMA of $3.10, reinforcing the bullishness.
- 50-day SMA: The 50-day simple moving average is at $2.68, with the share price at $3.48, suggesting medium-term bullish momentum.
- 200-day SMA: The significant 200-day SMA stands at $2.62, creating a strong bullish signal, and highlighting the Golden Cross.
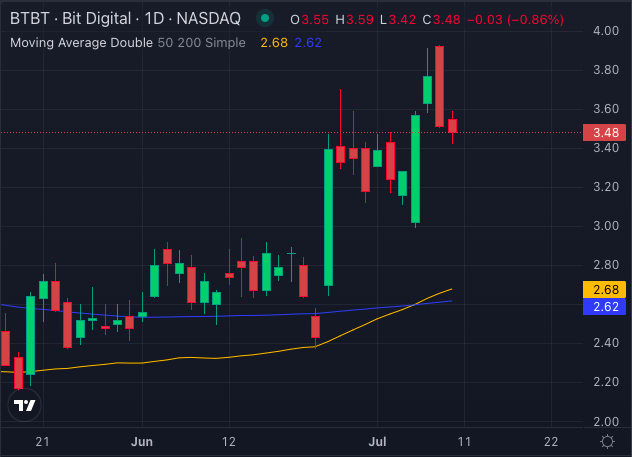
Chart created using Benzinga Pro
The Golden Cross occurs when a shorter-term moving average crosses above a longer-term moving average, typically signaling the potential for a bullish trend. In this case, The 50-day SMA at $2.68 has crossed over the 200-day SMA at $2.62, forming a Golden Cross.
Moreover, the price of Bit Digital share is above its 50-day and 200-day SMAs, reinforcing the bullish sentiment.
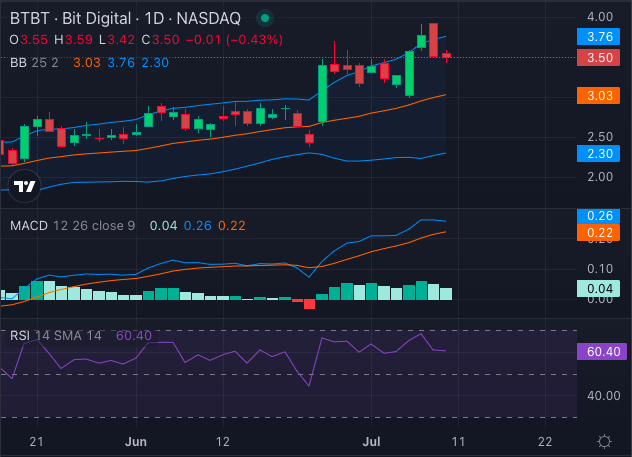
Chart created using Benzinga Pro
- MACD and RSI:
- MACD Indicator: The Moving Average Convergence Divergence (MACD) is at 0.26, suggesting continued buying momentum.
- RSI Indicator: The Relative Strength Index (RSI) stands at 60.40, indicating that Bit Digital is nearing overbought territory. While an RSI above 70 generally signals overbought conditions, the current level suggests there is still some room for upward movement.
- Bollinger Bands:
- 25-day Bollinger Bands: The bands range from $2.30 to $3.76, with the current price of $3.50 indicating bullishness.
Read Also: Bitcoin Spot ETFs Keep Buying The Dip This Week: Here's Why
Despite recent selling pressure indicating some risk of future bearish movement, the alignment of these technical indicators seems to suggest that Bit Digital is poised for potential gains. The Golden Cross, coupled with positive signals from the MACD, moving averages, and Bollinger Bands, points to a moderately bullish trend.
Investors should note that while the RSI indicates the stock is nearing overbought levels, the overall technical setup suggests there is still potential for upside. It is essential to consider broader market conditions and individual risk tolerance when making investment decisions.
BTBT Price Action: Bit Digital stock was trading at $3.51 at the time of publication.
- Why Bitcoin Has A 79% Chance Bitcoin To Dip Below $50K This Year
Image: Shutterstock