
It is hard to get excited after looking at W.W. Grainger's (NYSE:GWW) recent performance, when its stock has declined 10% over the past three months. But if you pay close attention, you might gather that its strong financials could mean that the stock could potentially see an increase in value in the long-term, given how markets usually reward companies with good financial health. In this article, we decided to focus on W.W. Grainger's ROE.
Return on Equity or ROE is a test of how effectively a company is growing its value and managing investors' money. Put another way, it reveals the company's success at turning shareholder investments into profits.
How To Calculate Return On Equity?
Return on equity can be calculated by using the formula:
Return on Equity = Net Profit (from continuing operations) ÷ Shareholders' Equity
So, based on the above formula, the ROE for W.W. Grainger is:
54% = US$1.9b ÷ US$3.5b (Based on the trailing twelve months to March 2024).
The 'return' is the yearly profit. One way to conceptualize this is that for each $1 of shareholders' capital it has, the company made $0.54 in profit.
What Has ROE Got To Do With Earnings Growth?
So far, we've learned that ROE is a measure of a company's profitability. Depending on how much of these profits the company reinvests or "retains", and how effectively it does so, we are then able to assess a company's earnings growth potential. Assuming all else is equal, companies that have both a higher return on equity and higher profit retention are usually the ones that have a higher growth rate when compared to companies that don't have the same features.
A Side By Side comparison of W.W. Grainger's Earnings Growth And 54% ROE
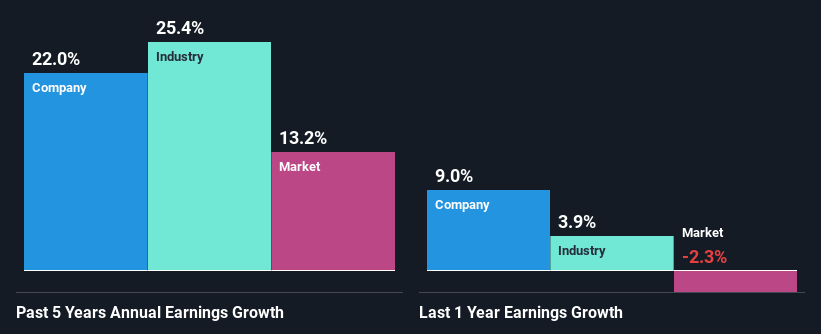
To begin with, W.W. Grainger has a pretty high ROE which is interesting. Additionally, the company's ROE is higher compared to the industry average of 17% which is quite remarkable. As a result, W.W. Grainger's exceptional 22% net income growth seen over the past five years, doesn't come as a surprise.
We then performed a comparison between W.W. Grainger's net income growth with the industry, which revealed that the company's growth is similar to the average industry growth of 25% in the same 5-year period.
Earnings growth is an important metric to consider when valuing a stock. It's important for an investor to know whether the market has priced in the company's expected earnings growth (or decline). By doing so, they will have an idea if the stock is headed into clear blue waters or if swampy waters await. One good indicator of expected earnings growth is the P/E ratio which determines the price the market is willing to pay for a stock based on its earnings prospects. So, you may want to check if W.W. Grainger is trading on a high P/E or a low P/E, relative to its industry.
Is W.W. Grainger Using Its Retained Earnings Effectively?
W.W. Grainger's ' three-year median payout ratio is on the lower side at 24% implying that it is retaining a higher percentage (76%) of its profits. So it looks like W.W. Grainger is reinvesting profits heavily to grow its business, which shows in its earnings growth.
Additionally, W.W. Grainger has paid dividends over a period of at least ten years which means that the company is pretty serious about sharing its profits with shareholders. Upon studying the latest analysts' consensus data, we found that the company is expected to keep paying out approximately 21% of its profits over the next three years.
Conclusion
Overall, we are quite pleased with W.W. Grainger's performance. Particularly, we like that the company is reinvesting heavily into its business, and at a high rate of return. Unsurprisingly, this has led to an impressive earnings growth. That being so, a study of the latest analyst forecasts show that the company is expected to see a slowdown in its future earnings growth. To know more about the company's future earnings growth forecasts take a look at this free report on analyst forecasts for the company to find out more.
Have feedback on this article? Concerned about the content? Get in touch with us directly. Alternatively, email editorial-team (at) simplywallst.com.
This article by Simply Wall St is general in nature. We provide commentary based on historical data and analyst forecasts only using an unbiased methodology and our articles are not intended to be financial advice. It does not constitute a recommendation to buy or sell any stock, and does not take account of your objectives, or your financial situation. We aim to bring you long-term focused analysis driven by fundamental data. Note that our analysis may not factor in the latest price-sensitive company announcements or qualitative material. Simply Wall St has no position in any stocks mentioned.
Have feedback on this article? Concerned about the content? Get in touch with us directly. Alternatively, email editorial-team@simplywallst.com