
Qilian International Holding Group Limited (NASDAQ:QLI) shareholders have had their patience rewarded with a 40% share price jump in the last month. Looking back a bit further, it's encouraging to see the stock is up 29% in the last year.
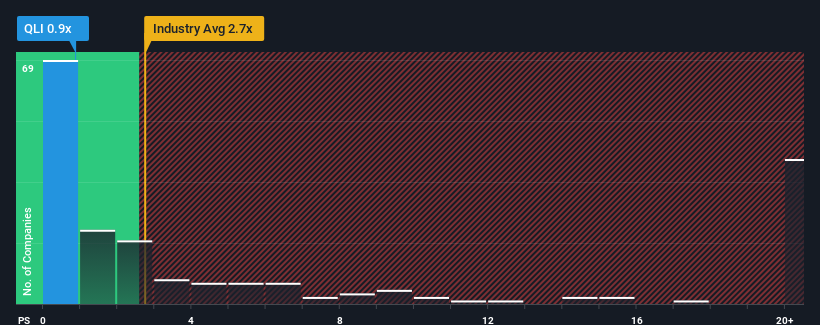
Although its price has surged higher, Qilian International Holding Group's price-to-sales (or "P/S") ratio of 0.9x might still make it look like a buy right now compared to the Pharmaceuticals industry in the United States, where around half of the companies have P/S ratios above 2.7x and even P/S above 11x are quite common. Nonetheless, we'd need to dig a little deeper to determine if there is a rational basis for the reduced P/S.
What Does Qilian International Holding Group's P/S Mean For Shareholders?
For instance, Qilian International Holding Group's receding revenue in recent times would have to be some food for thought. One possibility is that the P/S is low because investors think the company won't do enough to avoid underperforming the broader industry in the near future. However, if this doesn't eventuate then existing shareholders may be feeling optimistic about the future direction of the share price.
We don't have analyst forecasts, but you can see how recent trends are setting up the company for the future by checking out our free report on Qilian International Holding Group's earnings, revenue and cash flow.What Are Revenue Growth Metrics Telling Us About The Low P/S?
There's an inherent assumption that a company should underperform the industry for P/S ratios like Qilian International Holding Group's to be considered reasonable.
In reviewing the last year of financials, we were disheartened to see the company's revenues fell to the tune of 28%. This means it has also seen a slide in revenue over the longer-term as revenue is down 7.1% in total over the last three years. So unfortunately, we have to acknowledge that the company has not done a great job of growing revenue over that time.
Comparing that to the industry, which is predicted to deliver 18% growth in the next 12 months, the company's downward momentum based on recent medium-term revenue results is a sobering picture.
With this information, we are not surprised that Qilian International Holding Group is trading at a P/S lower than the industry. However, we think shrinking revenues are unlikely to lead to a stable P/S over the longer term, which could set up shareholders for future disappointment. There's potential for the P/S to fall to even lower levels if the company doesn't improve its top-line growth.
The Bottom Line On Qilian International Holding Group's P/S
The latest share price surge wasn't enough to lift Qilian International Holding Group's P/S close to the industry median. Generally, our preference is to limit the use of the price-to-sales ratio to establishing what the market thinks about the overall health of a company.
It's no surprise that Qilian International Holding Group maintains its low P/S off the back of its sliding revenue over the medium-term. At this stage investors feel the potential for an improvement in revenue isn't great enough to justify a higher P/S ratio. If recent medium-term revenue trends continue, it's hard to see the share price moving strongly in either direction in the near future under these circumstances.
Having said that, be aware Qilian International Holding Group is showing 3 warning signs in our investment analysis, and 2 of those are a bit concerning.
If companies with solid past earnings growth is up your alley, you may wish to see this free collection of other companies with strong earnings growth and low P/E ratios.
Have feedback on this article? Concerned about the content? Get in touch with us directly. Alternatively, email editorial-team (at) simplywallst.com.
This article by Simply Wall St is general in nature. We provide commentary based on historical data and analyst forecasts only using an unbiased methodology and our articles are not intended to be financial advice. It does not constitute a recommendation to buy or sell any stock, and does not take account of your objectives, or your financial situation. We aim to bring you long-term focused analysis driven by fundamental data. Note that our analysis may not factor in the latest price-sensitive company announcements or qualitative material. Simply Wall St has no position in any stocks mentioned.
Have feedback on this article? Concerned about the content? Get in touch with us directly. Alternatively, email editorial-team@simplywallst.com