
Universal Display's (NASDAQ:OLED) stock is up by a considerable 34% over the past three months. Given the company's impressive performance, we decided to study its financial indicators more closely as a company's financial health over the long-term usually dictates market outcomes. Specifically, we decided to study Universal Display's ROE in this article.
Return on equity or ROE is a key measure used to assess how efficiently a company's management is utilizing the company's capital. In other words, it is a profitability ratio which measures the rate of return on the capital provided by the company's shareholders.
How Do You Calculate Return On Equity?
ROE can be calculated by using the formula:
Return on Equity = Net Profit (from continuing operations) ÷ Shareholders' Equity
So, based on the above formula, the ROE for Universal Display is:
15% = US$220m ÷ US$1.5b (Based on the trailing twelve months to March 2024).
The 'return' is the profit over the last twelve months. Another way to think of that is that for every $1 worth of equity, the company was able to earn $0.15 in profit.
What Is The Relationship Between ROE And Earnings Growth?
Thus far, we have learned that ROE measures how efficiently a company is generating its profits. Depending on how much of these profits the company reinvests or "retains", and how effectively it does so, we are then able to assess a company's earnings growth potential. Assuming everything else remains unchanged, the higher the ROE and profit retention, the higher the growth rate of a company compared to companies that don't necessarily bear these characteristics.
Universal Display's Earnings Growth And 15% ROE
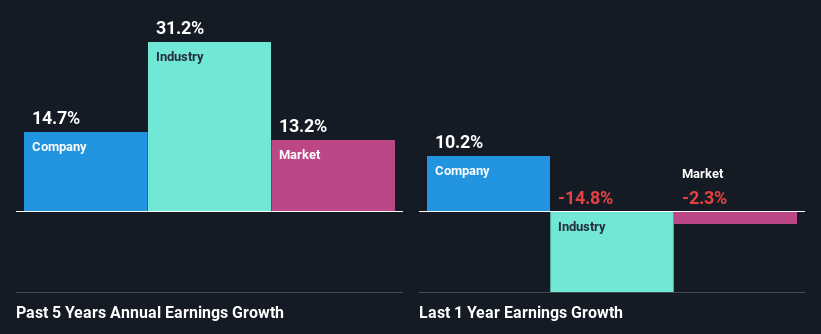
At first glance, Universal Display seems to have a decent ROE. Further, the company's ROE is similar to the industry average of 15%. This certainly adds some context to Universal Display's moderate 15% net income growth seen over the past five years.
We then compared Universal Display's net income growth with the industry and found that the company's growth figure is lower than the average industry growth rate of 31% in the same 5-year period, which is a bit concerning.
Earnings growth is an important metric to consider when valuing a stock. What investors need to determine next is if the expected earnings growth, or the lack of it, is already built into the share price. By doing so, they will have an idea if the stock is headed into clear blue waters or if swampy waters await. Is Universal Display fairly valued compared to other companies? These 3 valuation measures might help you decide.
Is Universal Display Efficiently Re-investing Its Profits?
Universal Display has a healthy combination of a moderate three-year median payout ratio of 27% (or a retention ratio of 73%) and a respectable amount of growth in earnings as we saw above, meaning that the company has been making efficient use of its profits.
Additionally, Universal Display has paid dividends over a period of seven years which means that the company is pretty serious about sharing its profits with shareholders. Based on the latest analysts' estimates, we found that the company's future payout ratio over the next three years is expected to hold steady at 27%.
Summary
Overall, we are quite pleased with Universal Display's performance. Particularly, we like that the company is reinvesting heavily into its business, and at a high rate of return. As a result, the decent growth in its earnings is not surprising. We also studied the latest analyst forecasts and found that the company's earnings growth is expected be similar to its current growth rate. To know more about the latest analysts predictions for the company, check out this visualization of analyst forecasts for the company.
Have feedback on this article? Concerned about the content? Get in touch with us directly. Alternatively, email editorial-team (at) simplywallst.com.
This article by Simply Wall St is general in nature. We provide commentary based on historical data and analyst forecasts only using an unbiased methodology and our articles are not intended to be financial advice. It does not constitute a recommendation to buy or sell any stock, and does not take account of your objectives, or your financial situation. We aim to bring you long-term focused analysis driven by fundamental data. Note that our analysis may not factor in the latest price-sensitive company announcements or qualitative material. Simply Wall St has no position in any stocks mentioned.
Have feedback on this article? Concerned about the content? Get in touch with us directly. Alternatively, email editorial-team@simplywallst.com