
On Thursday, July 4th, spot gold slightly fell 0.1%, closing at $2,353.14 per ounce, but still hovering near the two-week high reached the previous trading day.

On Wednesday, US economic data was worse than expected, and the tone of Fed Chairman Powell's remarks changed, increasing people's bets that the Fed will cut interest rates earlier than previously expected. Weak US data includes the US ISM Service Purchasing Managers Index (PMI) released on Wednesday, which shows that the industry's growth has slowed. This data is particularly important because the industry has been the main driving force for rising inflation rates. The June index fell from 53.8 in May to 48.8, well below the widely expected 52.5. Although the sub-item of service price payments is still in the expansion range at 56.3, it is still lower than May's 58.1. US initial jobless claims also increased last week, and the number of unemployed people rose to a two-and-a-half-year high at the end of June, consistent with the trend of cooling labor market. This, coupled with weakening inflation, has further enhanced expectations that the Federal Reserve will begin to cut interest rates this year. Traders are currently focusing on the US non-farm employment data to be released on Friday. City Index senior analyst Matt Simpson said: "The weaker-than-expected ISM service industry report is the gift that the Fed's doves have been waiting for before the release of non-farm employment data. If the non-farm employment data confirms the economic cracks we have seen elsewhere, gold prices may rise to $2,400." It is foreseeable that as long as the non-farm employment growth on Friday is lower than expected, the charging sound for gold long positions will surely be sounded in investors' minds. However, at the same time, it is necessary to be wary of the risk of unexpected data being exceptionally strong and bringing selling pressure to gold.
Source: E-huitong
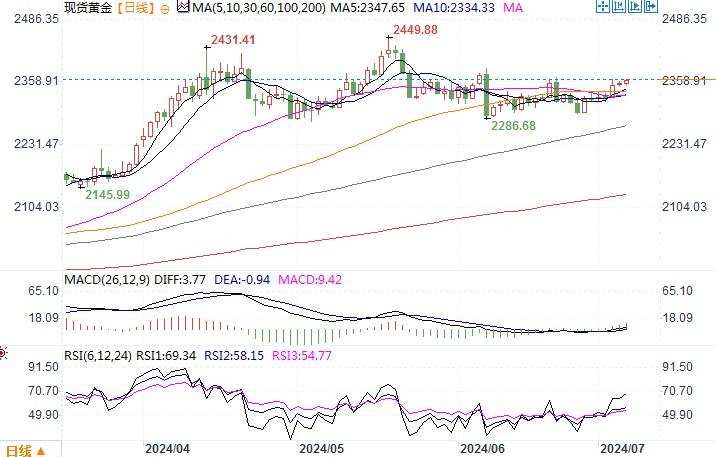
Technically, the Bollinger Bands on the daily chart are shrinking and running horizontally. The pressure position of horizontal operation is around 2370, the support position below is near 2332, followed by 2293. The MACD indicator is currently a golden cross, while the relative strength index RSI still maintains a balanced state, indicating that the trend has not yet deviated from the horizontal oscillation pattern. Pay close attention to the US non-farm data tonight, and if the data is weak and the gold price breaks through the upper limit of the horizontal range of nearly two months at the $2368 level, the trend of rising gold prices will become apparent. On the contrary, gold will be suppressed and continue its range-bound oscillation trend.
Wang Gang, Bank of China Guangdong Branch
For personal views only, not representative of the views of the organization.