
AT&T Inc (NYSE:T) soared to a new 52-week high of $19.32 during day trading on July 1, showcasing a robust upward trajectory.
The stock has climbed an impressive 17.74% over the past year and is up 13.11% year-to-date, signaling a strong bullish trend.
With the share price consistently above its key moving averages, AT&T is riding high, though a slight selling pressure is being observed. See below.
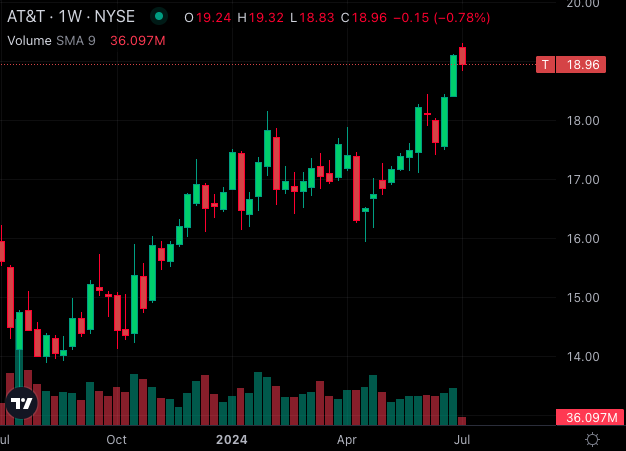
Chart created using Benzinga Pro
Bullish Signals Across the Board
At a current share price of $18.96, AT&T is comfortably above its 5, 20 and 50-day exponential moving averages, reinforcing the bullish sentiment.
Here's a closer look at the technical indicators lighting up with bullish signals:
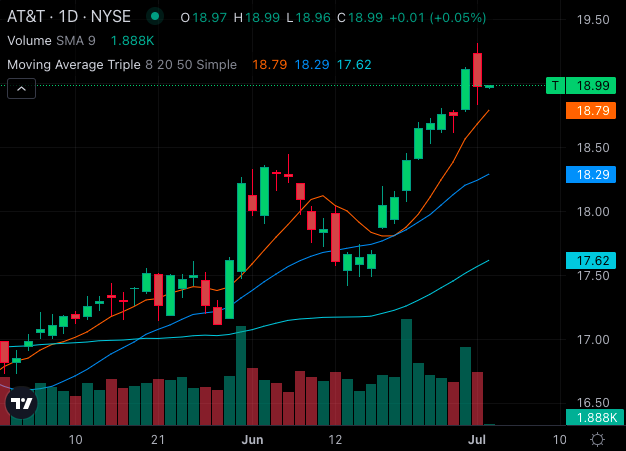
Chart created using Benzinga Pro
- Simple Moving Averages: AT&T's share price of $18.99 is above its 8-day SMA of $18.79, 20-day SMA of $18.29 and 50-day SMA of $17.62. The 200-day SMA, standing at $16.66, further solidifies the bullish stance. These moving averages collectively indicate continued upward momentum.
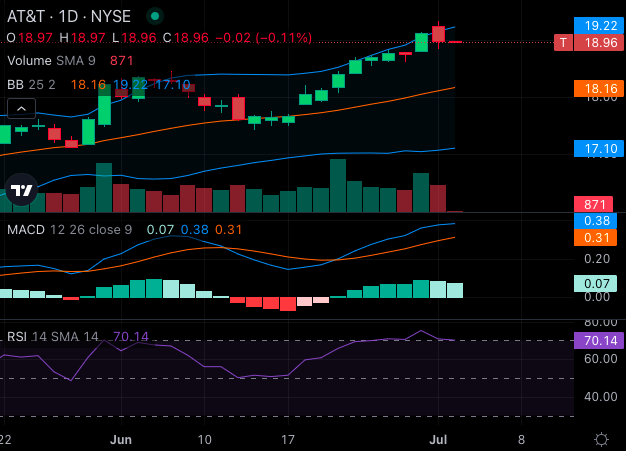
- MACD Indicator: The Moving Average Convergence Divergence (MACD) indicator for AT&T is at 0.38, a positive reading that underscores the bullish sentiment. This suggests that the stock is in a healthy uptrend, with the MACD line staying above the signal line.
- RSI and Bollinger Bands: The Relative Strength Index (RSI) for AT&T is at 70.14, indicating that the stock is overbought. Despite this, the Bollinger Bands provide additional bullish signals. The 25-day range of $17.10 – $19.22 suggests that the stock is poised for further gains.
Read Also: Eli Lilly Soars To 52-Week High: Can The Momentum Continue?
52-Week High: A Bullish Milestone
The achievement of a new 52-week high at $19.32 is a significant milestone for AT&T. This high is a technical affirmation of the stock's strength. It indicates strong investor confidence and could attract more buying interest, potentially driving the stock price higher.
Overall, AT&T's technical setup is overwhelmingly bullish. The stock's performance above key moving averages, positive MACD reading and favorable Bollinger Bands all point towards a continued uptrend. However, with the RSI indicating overbought conditions, investors should remain cautious of potential short-term pullbacks.
Nonetheless, the new 52-week high underscores AT&T's solid momentum and bullish outlook.
- Verizon, AT&T, And T-Mobile Set For Gains, Goldman Sachs Cites AI and Data Center Demand
Image: Unsplash