
Nike Inc. (NYSE:NKE) just sprinted past a new 52-week low, dipping to $74.55 during day trading on Friday. With the stock down 33.32% year-over-year and 30.58% year-to-date, investors are wondering if the iconic brand has lost its footing.
Nike Q4 Earnings Blues
The recent sell-off comes on the heels of Nike's fourth-quarter earnings call, where CFO Matthew Friend painted a less-than-rosy picture for fiscal 2025. The company now expects a mid-single-digit decline in reported revenue, a sharp pivot from previous growth projections.
Nike anticipates a 10% revenue drop in the first quarter, driven by aggressive management of classic footwear lines, ongoing challenges in digital sales, subdued wholesale orders, a softer outlook in Greater China and several timing-related factors.
Adding to the woes, foreign exchange headwinds are expected to shave off one point from the year's revenue.
Read Also: Nike Q4 Earnings Highlights: Revenue Miss, EPS Beat, 'Taking Our Near-Term Challenges Head-On'
In response, a slew of analysts, including those from Citigroup, Wells Fargo, HSBC, Goldman Sachs, Barclays, BofA Securities, JPMorgan, Morgan Stanley and Wedbush, have slashed their price targets. Despite the lowered targets, the average analyst price target of $107.25 still suggests a potential 35%+ upside from current levels.
Nike Stock – Technical Signals Are Bearish
Nike's technical indicators are waving red flags. The stock is currently trading below its 5, 20 and 50-day exponential moving averages, signaling a strongly bearish trend.
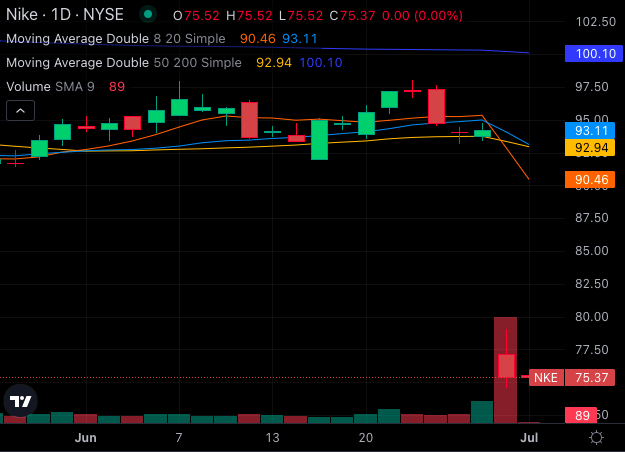
Chart: Benzinga Pro
With the share price at $75.37, well below key moving averages—$90.46 (8-day), $93.11 (20-day), $92.94 (50-day) and $100.10 (200-day)—the outlook appears grim.
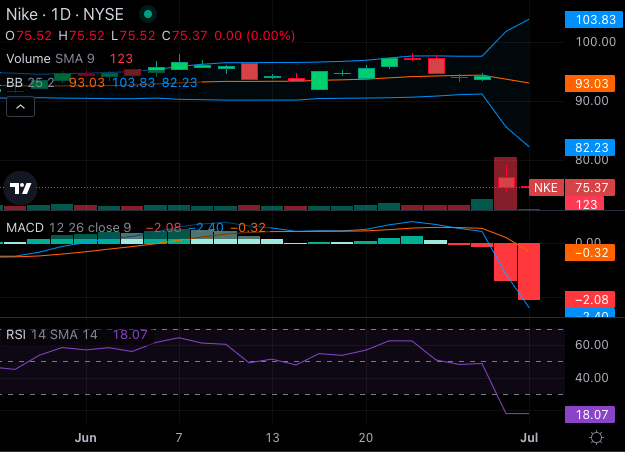
Chart: Benzinga Pro
The Moving Average Convergence Divergence (MACD) indicator at -2.40 further confirms the bearish momentum. Additionally, the Relative Strength Index (RSI) of 18.07 suggests the stock is oversold, typically a precursor to a potential rebound, but also a sign of significant selling pressure.
Bollinger Bands add to the bearish sentiment with the 25-day bands ranging from $82.23 to $103.83, with Nike stock price moving towards the lower bearish band. Also, the widening bands indicate that price volatility for this stock has increased.
Can Nike Bounce Back?
While the current technical signals are decidedly bearish, the company's strong brand and history of innovation could provide a foundation for a comeback. If Nike can navigate its short-term challenges and capitalize on its strategic initiatives, there may still be light at the end of the tunnel.
For now, the stock's journey toward recovery hinges on overcoming significant headwinds and proving that it can bounce back stronger. Investors will be closely watching Nike's next moves to see if it can reclaim its stride.
- Nike Analysts Sour On Retailer's Short-Term Prospects Following Poor Outlook: 'No Quick Rebound'
Photo: Shutterstock