
 行业层面,银行、石油石化、电力及公用事业上周领涨,房地产、计算机、非银金融等表现偏弱。
Last week, the net subscription of equity ETF was 42.083 billion yuan, with a total increase of 4.134 billion yuan in overall scale.
I. Market Overview
A-share market: Last week (June 24-June 28), A-share market continued its weakness, with major indexes falling. SSE 50 performed slightly better, while the decline of Sci-Tech 50 was deeper. The Shanghai and Shenzhen 300 index, which tends to focus on blue chips, fell by 1.0% last week, while growth-style Sci-Tech 50 and Chinext Price Index fell by 6.1% and 4.1%, respectively. CSI Dividend Index fell by 1.2%. Northbound funds net outflows totaled RMB 11.762 billion last week, with a total net outflow of RMB 44.4 billion in June. The average daily turnover last week dropped to RMB 660 billion.
 On an industry level, banks, oil and petrochemicals, electrical utilities and public utilities led the gains last week, while real estate, computer and non-bank financials performed weakly.
In terms of fund performance, funds with themes such as banks, electrical utilities, state-owned enterprises and oil and gas had relatively good performance, while funds with themes such as Sci-Tech chips, photovoltaics, semiconductors and real estate had relatively poor performance.
II. Capital Trends
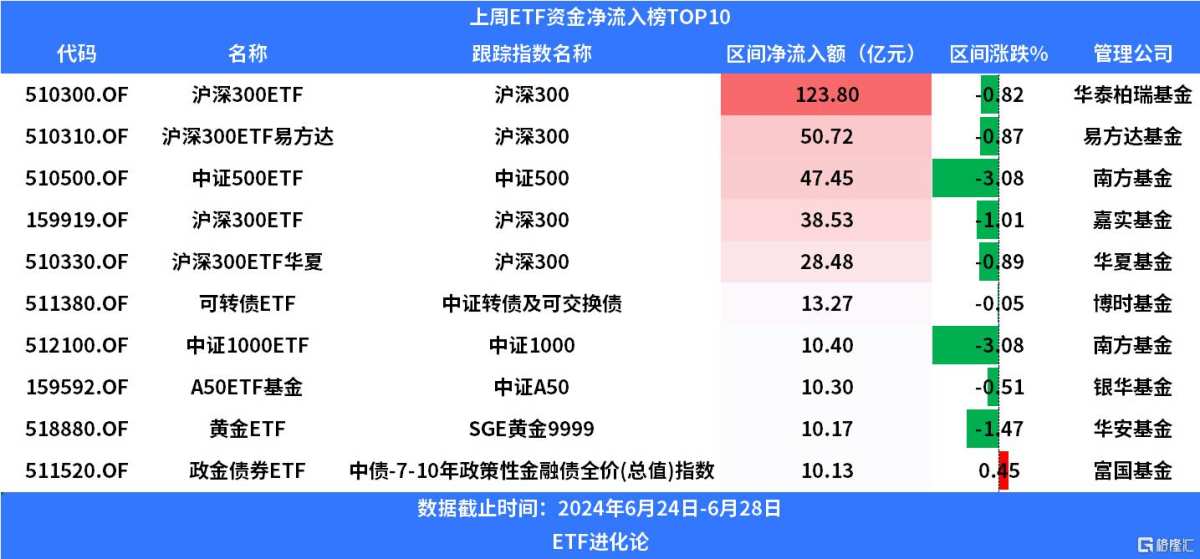
Last week, stock ETFs had a net purchase of RMB 42.083 billion, with a total increase in size of RMB 4.134 billion. Among broad-based ETFs, the Shanghai and Shenzhen 300 ETF had the most net purchases at RMB 23.885 billion. Among sectors, the financial ETF had the most net purchases at RMB 2.52 billion. Among hot topics, the securities ETF had the most net purchases at RMB 1.717 billion.
Specifically, Huatai-PB ChinaAMC CSI 300 ETF, HS300ETF, China Southern CSI 300 ETF and Huaxia CSI 300 ETF had net inflows of RMB 12.38 billion, RMB 5.072 billion, RMB 3.853 billion and RMB 2.848 billion respectively last week.
In terms of other broad-based indexes, the Southern CSI 500 ETF, Southern CSI 1000 ETF and Hwabao WP CSI A50 ETF had net inflows of RMB 4.745 billion, RMB 1.04 billion and RMB 1.03 billion respectively last week.
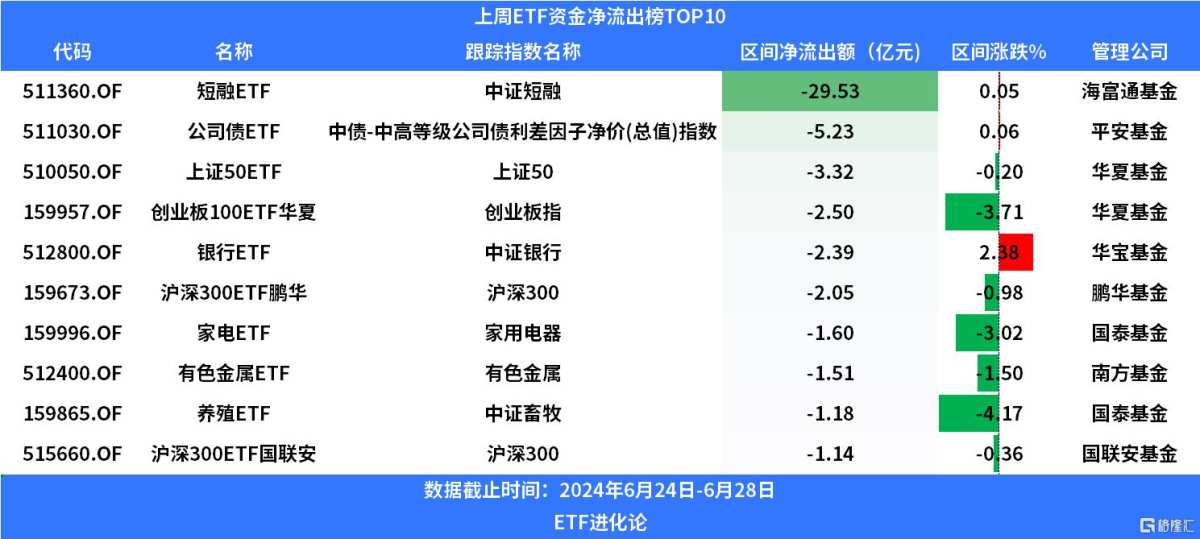
In terms of fixed-income ETFs, funds continued to reduce their holding of short-term financing ETFs, while increasing their holding of convertible bond ETFs and China Securities Journal bond ETFs. Last week, HFT CSI Short-Term Financing ETF had net outflows of RMB 2.953 billion, while Bosera CSI Convertible Bond and Exchangeable Bond ETF and Fuguo CSI Bond ETF had net inflows of RMB 1.327 billion and RMB 1.013 billion respectively.
In terms of net outflows, funds slightly reduced their holdings of SSE 50 ETF, with HDFund SSE 50 ETF suffering a net outflow of RMB 0.332 billion last week. The home appliances sector suffered a correction last week, with Guotai Junan CSI All Share Household Appliances ETF suffering a net outflow of RMB 0.16 billion.
From the perspective of shares, data from Wind shows that ETF shares increased by 27.23 billion shares (+1.25%), reaching 2,207.335 billion shares; the total size decreased by RMB 504 million (-0.02%), reaching RMB 2,469.191 billion; the average daily turnover increased by RMB 7.645 billion (+5.78%), reaching RMB 139.829 billion.
Last week, the industry with the largest increase in shares was the financial industry, currently with 24 funds to track. The theme with the largest increase in shares was the CSI Medical Service Index, with 4 funds tracking it. The index with the largest increase in shares was the CSI 300 (+3.86%), with 23 funds tracking it; the index with the highest return was the Dongzheng Index (+3.12%), with 1 fund tracking it.

Last week, the stock ETF margin financing balance rose from RMB 38.862 billion in the previous week to RMB 40.213 billion, while the securities lending balance fell from 4.167 billion shares in the previous week to 4.151 billion shares. Among the top 10 ETFs with the highest daily margin financing buy-in amount and securities lending sell-out volume, the Sci-Tech Board ETF and the Securities ETF had relatively high daily margin financing buy-in amounts, while the CSI 1000 ETF and the CSI 500 ETF had relatively high daily securities lending sell-out volumes.
III. ETF Performance Changes
Last week, the median weekly return for stock ETFs was -2.31%. Among broad-based ETFs, SSE 50 ETF had the highest median rise and fall rate of 0.04%. In terms of sectors, the median rise and fall rate of cyclical ETFs was -1.54%, with the smallest decline. By category, bank ETF had the highest median rise and fall rate of 2.43%, with the best performance.
Last week, Japan-themed ETF performed best, with Huaxia Fund Nikkei ETF up 4.47% and US-related ETFs maintaining their strong performance, Boshi Fund S&P 500 ETF and Huaxia Fund Nasdaq ETF up 2.98% and 2.59% respectively. State-owned enterprise-themed ETFs also performed actively last week, with Guotai Fund State-owned Enterprise Win-win ETF up 2.67% last week.

Chip-themed ETFs and photovoltaic ETFs fell incessantly last week, with Southern SCI Chip ETF, Jiashi Fund Science and Technology ETF, GF Fund Chip Equipment ETF and GF Fund Photovoltaic 30 ETF falling 7.9%, 6.93%, 6.66% and 6.3% respectively last week.

4. Newly-launched ETF products
Seven new ETFs were established last week, including GF CSI Science and Innovation Board 100 Enhanced Strategy ETF, E Fund CSI Science and Innovation Board 100 Enhanced Strategy ETF, GF CSI Guoxin Hongli ETF, Invesco Great Wall CSI Guoxin Hongli ETF, Penghua CSI 800 ETF, Southern CSI Guoxin Hongli ETF, and Fullgoal CSI Communication Equipment Thematic ETF.
There will be one ETF to be issued this week, Fullgoal CSI Central Enterprise Dividend ETF.

5. Hot news
In the first half of this year, China's ETF scale exceeded RMB 2.4 trillion.
Since the beginning of this year, China's ETF market has experienced rapid development. According to Wind Information data as of June 30, the total number of ETFs in the entire market is 973, an increase of 76 from the beginning of 2024; the ETF share has exceeded 2.2 trillion shares, an increase of 194.144 billion shares from the beginning of the year; the net asset value has exceeded the threshold of RMB 2.4 trillion, an increase of RMB 419.107 billion from the beginning of the year, including the scale of equity ETFs exceeding the threshold of RMB 1.8 trillion.
In the first half of this year, non-commodity ETFs increased by RMB 435.548 billion, and broad-based ETFs are the most attractive.
As the first half of 2024 comes to an end, according to Wind data as of June 29, the total scale of non-commodity ETFs is RMB 2.28 trillion, an increase of RMB 435.548 billion from the end of last year. E Fund SSE 300 ETF, Huatai-PineBridge SSE 300 ETF, Jiashi SSE 300 ETF, Huaxia SSE 300 ETF, and Huaxia SSE 50 ETF were the top five in terms of scale growth, with increases of RMB 90.453 billion, RMB 80.736 billion, RMB 62.27 billion, RMB 61.542 billion, and RMB 32.711 billion respectively this year.
It is reported that the SEC may approve the Ethereum spot ETF as early as July 4th.
According to some industry executives and insiders cited by the media, the U.S. Securities and Exchange Commission (SEC) may approve an exchange-traded fund (ETF) linked to the spot price of Ethereum as early as July 4, and negotiations between asset management companies and regulatory agencies have entered the final stage.