
Some say volatility, rather than debt, is the best way to think about risk as an investor, but Warren Buffett famously said that 'Volatility is far from synonymous with risk.' When we think about how risky a company is, we always like to look at its use of debt, since debt overload can lead to ruin. We note that Syntec Optics Holdings, Inc. (NASDAQ:OPTX) does have debt on its balance sheet. But the real question is whether this debt is making the company risky.
Why Does Debt Bring Risk?
Debt assists a business until the business has trouble paying it off, either with new capital or with free cash flow. Part and parcel of capitalism is the process of 'creative destruction' where failed businesses are mercilessly liquidated by their bankers. While that is not too common, we often do see indebted companies permanently diluting shareholders because lenders force them to raise capital at a distressed price. Having said that, the most common situation is where a company manages its debt reasonably well - and to its own advantage. When we think about a company's use of debt, we first look at cash and debt together.
How Much Debt Does Syntec Optics Holdings Carry?
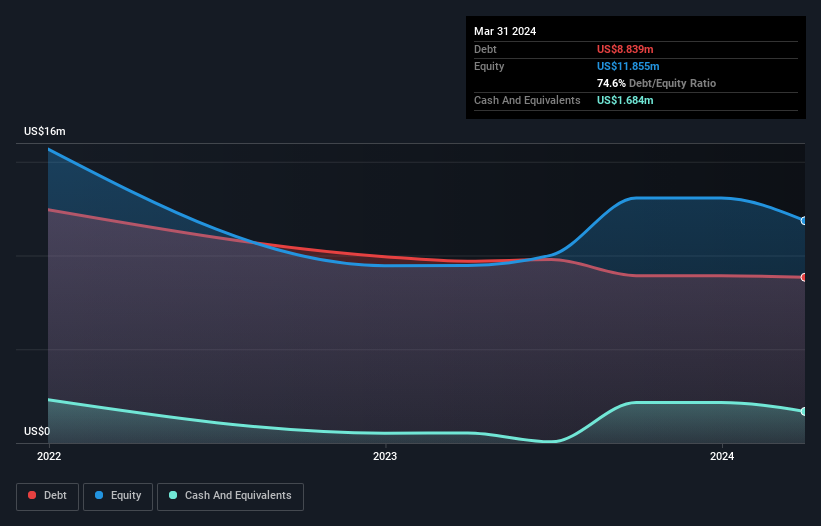
As you can see below, Syntec Optics Holdings had US$8.84m of debt at March 2024, down from US$9.69m a year prior. On the flip side, it has US$1.68m in cash leading to net debt of about US$7.15m.
How Healthy Is Syntec Optics Holdings' Balance Sheet?
We can see from the most recent balance sheet that Syntec Optics Holdings had liabilities of US$9.81m falling due within a year, and liabilities of US$2.95m due beyond that. Offsetting this, it had US$1.68m in cash and US$5.09m in receivables that were due within 12 months. So it has liabilities totalling US$5.99m more than its cash and near-term receivables, combined.
Since publicly traded Syntec Optics Holdings shares are worth a total of US$86.2m, it seems unlikely that this level of liabilities would be a major threat. Having said that, it's clear that we should continue to monitor its balance sheet, lest it change for the worse. When analysing debt levels, the balance sheet is the obvious place to start. But it is Syntec Optics Holdings's earnings that will influence how the balance sheet holds up in the future. So if you're keen to discover more about its earnings, it might be worth checking out this graph of its long term earnings trend.
Over 12 months, Syntec Optics Holdings reported revenue of US$29m, which is a gain of 3.7%, although it did not report any earnings before interest and tax. That rate of growth is a bit slow for our taste, but it takes all types to make a world.
Caveat Emptor
Over the last twelve months Syntec Optics Holdings produced an earnings before interest and tax (EBIT) loss. To be specific the EBIT loss came in at US$60k. Considering that alongside the liabilities mentioned above does not give us much confidence that company should be using so much debt. Quite frankly we think the balance sheet is far from match-fit, although it could be improved with time. Surprisingly, we note that it actually reported positive free cash flow of US$186k and a profit of US$714k. So one might argue that there's still a chance it can get things on the right track. When analysing debt levels, the balance sheet is the obvious place to start. But ultimately, every company can contain risks that exist outside of the balance sheet. For example, we've discovered 3 warning signs for Syntec Optics Holdings (1 shouldn't be ignored!) that you should be aware of before investing here.
If you're interested in investing in businesses that can grow profits without the burden of debt, then check out this free list of growing businesses that have net cash on the balance sheet.
Have feedback on this article? Concerned about the content? Get in touch with us directly. Alternatively, email editorial-team (at) simplywallst.com.
This article by Simply Wall St is general in nature. We provide commentary based on historical data and analyst forecasts only using an unbiased methodology and our articles are not intended to be financial advice. It does not constitute a recommendation to buy or sell any stock, and does not take account of your objectives, or your financial situation. We aim to bring you long-term focused analysis driven by fundamental data. Note that our analysis may not factor in the latest price-sensitive company announcements or qualitative material. Simply Wall St has no position in any stocks mentioned.
Have feedback on this article? Concerned about the content? Get in touch with us directly. Alternatively, email editorial-team@simplywallst.com