
On Wednesday, June 26th, Bitcoin (BTC) prices consolidated above $61,000, driven by positive inflows from the ETF of the spot BTC exchange. Product structure-wise, the operating income for 10-30 billion yuan products was 401/1288/60 million yuan, respectively.

(Source: TradingView)
According to data from Farside Investors, on Tuesday, the US-listed spot BTC ETF had a net inflow of $31 million, ending the situation of nearly $1.135 billion outflow for seven consecutive days.
Monday's pullback was mainly attributed to Mt. Gox's announcement that it would soon distribute Bitcoin to creditors, which raised concerns about the impending large-scale token sell-off. Since then, this concern has gradually faded, and many analysts have quickly pointed out that the market has had similar reactions to multiple announcements of Mt. Gox Bitcoin distribution.
Matthew Kaye, the director of operation and strategy at Intuition Systems, said in a report shared with Kitco Crypto: "As is often seen in the market, the headline news of the announcement of the distribution of Mt. Gox inventory marks the local bottom of this weeks-long BTC sell-off." "Shanzhai coins found their bottom before BTC, and the meme sector has once again proven to be the best-performing sector in cryptocurrencies."
"Although Mt. Gox's pending claims may have originally appeared bearish, the fact is that these claims have lasted for ten years, and most of the sell-offs may have been priced in," he added. "In addition, there have been more sell-offs in the past few weeks, which may be those who intend to buy back at a low price."
"This means that no matter what Mt. Gox and the German government sell, it only provides entry liquidity," Kaye concluded. "As the market finally puts the Gox incident behind it, the irrational time of bearishness is coming to an end. It's always best to never assume that cryptocurrencies are dead, and buying low is usually a buying opportunity."
Crypto analysts agree with Kaye's views, with most predicting that Bitcoin will soon rise based on technical analysis and key indicators.
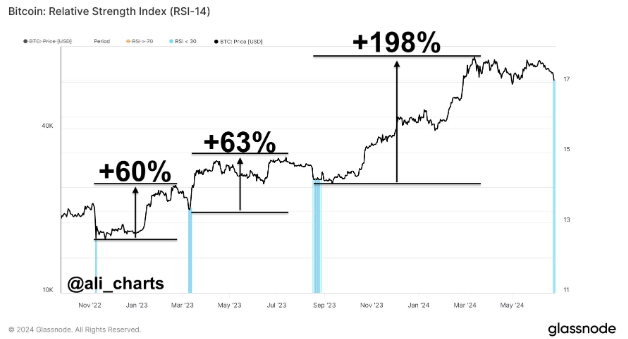
Market analyst Ali Martinez released the following chart, highlighting Bitcoin's Relative Strength Index (RSI), indicating a double-digit percentage growth after the oversold area entry and subsequent sell-off.
(Source: Kitco)
Martinez wrote on X: "Imagine an indicator that signals the best time to buy#Bitcoin low...simplify things, study daily $BTC RSI."
Cryptocurrency giant further elaborated on Martinez's observations, noting that the two previous cases of similar divergences resulted in "Bitcoin going into a frenzy mode."

(Source: X)
Market analyst Moustache pointed out that the Cryptocurrency Fear and Greed Index signaled "fear" in the past, and Bitcoin has retested the previous cycle's high, providing a strong bullish signal for future price performance.

(Source: X)
Faibik Captain conducted a more cautious analysis of the price trend, pointing out that "$BTC has been moving within the green box between the 60k and 70k support and resistance levels for the past 4 months."

(Source: Kitco)
"Before Bitcoin breaks through these two levels, no clear conclusion can be drawn, so it's best to wait and see. (Because trading is a patient game.)" said Faibik Captain. "If Bitcoin successfully breaks through the 70k resistance level, we may see a 30-40% bullish wave. In the bearish case, if Bitcoin breaks through the 60k support level and the weekly EMA21 level, it may hit the 50k level in the coming weeks."
"There is one more thing: as long as Bitcoin is moving within the green box, it is still in the safe zone, and the Bitcoin bulls are fully in control," he concluded.
John Glover, the Chief Investment Officer of Ledn, also warned that Bitcoin could fall to the midway point of $50,000 before resuming its upward trend.
Glover said in a report shared with Kitco Crypto: 'The fifth wave (orange line in the chart) continues to develop as expected. (ii) of the fifth wave may completely retrace wave (i), which could lead to a retest of $565,000 before the next rebound.'

(Image source: Kitco)
'Someone asked me if the third wave could still be incomplete, as shown in the yellow line on the chart,' he added. 'It's possible, although it's not a wave count I like.' 'If that is indeed the case, then the ultimate target for Wave 5 will be around $110,000, rather than $85,000 to $95,000,' he concluded. 'Once prices exceed $80,000, I will review the price trend to determine if the yellow count is more likely.'
'If that is indeed the case, then the ultimate target for Wave 5 will be around $110,000, rather than $85,000 to $95,000,' he concluded. 'Once prices exceed $80,000, I will review the price trend to determine if the yellow count is more likely.'