
Passive investing in index funds can generate returns that roughly match the overall market. But you can significantly boost your returns by picking above-average stocks. For example, the Mercury General Corporation (NYSE:MCY) share price is up 72% in the last 1 year, clearly besting the market return of around 22% (not including dividends). That's a solid performance by our standards! Unfortunately the longer term returns are not so good, with the stock falling 18% in the last three years.
Now it's worth having a look at the company's fundamentals too, because that will help us determine if the long term shareholder return has matched the performance of the underlying business.
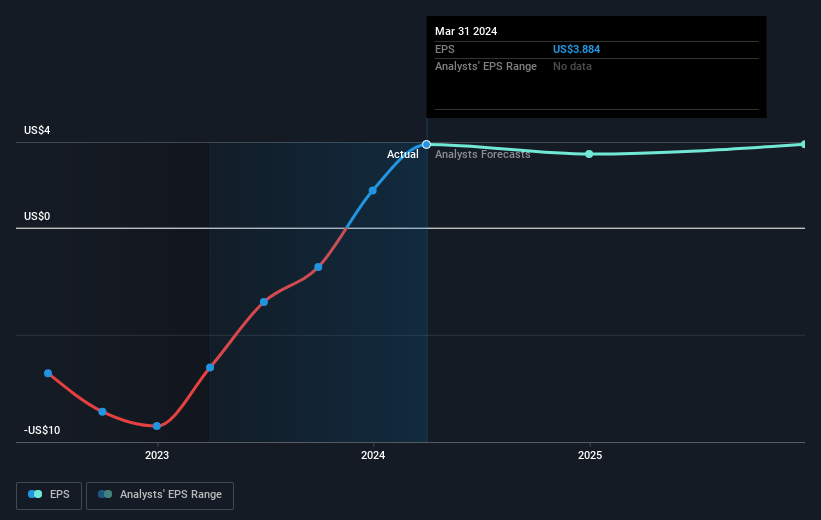
To paraphrase Benjamin Graham: Over the short term the market is a voting machine, but over the long term it's a weighing machine. One flawed but reasonable way to assess how sentiment around a company has changed is to compare the earnings per share (EPS) with the share price.
Mercury General went from making a loss to reporting a profit, in the last year.
We think the growth looks very prospective, so we're not surprised the market liked it too. Inflection points like this can be a great time to take a closer look at a company.
The image below shows how EPS has tracked over time (if you click on the image you can see greater detail).
We're pleased to report that the CEO is remunerated more modestly than most CEOs at similarly capitalized companies. It's always worth keeping an eye on CEO pay, but a more important question is whether the company will grow earnings throughout the years. Before buying or selling a stock, we always recommend a close examination of historic growth trends, available here..
What About Dividends?
When looking at investment returns, it is important to consider the difference between total shareholder return (TSR) and share price return. The TSR incorporates the value of any spin-offs or discounted capital raisings, along with any dividends, based on the assumption that the dividends are reinvested. So for companies that pay a generous dividend, the TSR is often a lot higher than the share price return. In the case of Mercury General, it has a TSR of 77% for the last 1 year. That exceeds its share price return that we previously mentioned. This is largely a result of its dividend payments!
A Different Perspective
We're pleased to report that Mercury General shareholders have received a total shareholder return of 77% over one year. Of course, that includes the dividend. That gain is better than the annual TSR over five years, which is 0.7%. Therefore it seems like sentiment around the company has been positive lately. Given the share price momentum remains strong, it might be worth taking a closer look at the stock, lest you miss an opportunity. It's always interesting to track share price performance over the longer term. But to understand Mercury General better, we need to consider many other factors. Case in point: We've spotted 1 warning sign for Mercury General you should be aware of.
For those who like to find winning investments this free list of undervalued companies with recent insider purchasing, could be just the ticket.
Please note, the market returns quoted in this article reflect the market weighted average returns of stocks that currently trade on American exchanges.
Have feedback on this article? Concerned about the content? Get in touch with us directly. Alternatively, email editorial-team (at) simplywallst.com.
This article by Simply Wall St is general in nature. We provide commentary based on historical data and analyst forecasts only using an unbiased methodology and our articles are not intended to be financial advice. It does not constitute a recommendation to buy or sell any stock, and does not take account of your objectives, or your financial situation. We aim to bring you long-term focused analysis driven by fundamental data. Note that our analysis may not factor in the latest price-sensitive company announcements or qualitative material. Simply Wall St has no position in any stocks mentioned.
Have feedback on this article? Concerned about the content? Get in touch with us directly. Alternatively, email editorial-team@simplywallst.com