
It is hard to get excited after looking at Chemed's (NYSE:CHE) recent performance, when its stock has declined 17% over the past three months. However, the company's fundamentals look pretty decent, and long-term financials are usually aligned with future market price movements. In this article, we decided to focus on Chemed's ROE.
Return on Equity or ROE is a test of how effectively a company is growing its value and managing investors' money. In short, ROE shows the profit each dollar generates with respect to its shareholder investments.
How To Calculate Return On Equity?
The formula for ROE is:
Return on Equity = Net Profit (from continuing operations) ÷ Shareholders' Equity
So, based on the above formula, the ROE for Chemed is:
24% = US$283m ÷ US$1.2b (Based on the trailing twelve months to March 2024).
The 'return' is the yearly profit. That means that for every $1 worth of shareholders' equity, the company generated $0.24 in profit.
What Is The Relationship Between ROE And Earnings Growth?
So far, we've learned that ROE is a measure of a company's profitability. We now need to evaluate how much profit the company reinvests or "retains" for future growth which then gives us an idea about the growth potential of the company. Assuming all else is equal, companies that have both a higher return on equity and higher profit retention are usually the ones that have a higher growth rate when compared to companies that don't have the same features.
Chemed's Earnings Growth And 24% ROE
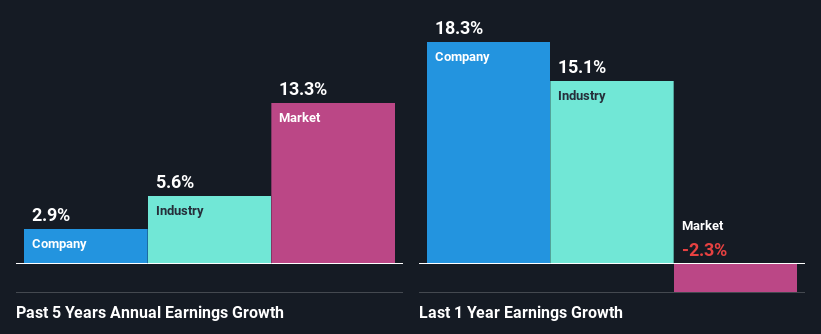
First thing first, we like that Chemed has an impressive ROE. Secondly, even when compared to the industry average of 11% the company's ROE is quite impressive. Yet, Chemed has posted measly growth of 2.9% over the past five years. This is interesting as the high returns should mean that the company has the ability to generate high growth but for some reason, it hasn't been able to do so. Such a scenario is likely to take place when a company pays out a huge portion of its earnings as dividends, or is faced with competitive pressures.
We then compared Chemed's net income growth with the industry and found that the company's growth figure is lower than the average industry growth rate of 5.6% in the same 5-year period, which is a bit concerning.
The basis for attaching value to a company is, to a great extent, tied to its earnings growth. What investors need to determine next is if the expected earnings growth, or the lack of it, is already built into the share price. This then helps them determine if the stock is placed for a bright or bleak future. What is CHE worth today? The intrinsic value infographic in our free research report helps visualize whether CHE is currently mispriced by the market.
Is Chemed Making Efficient Use Of Its Profits?
A low three-year median payout ratio of 8.4% (implying that the company retains the remaining 92% of its income) suggests that Chemed is retaining most of its profits. This should be reflected in its earnings growth number, but that's not the case. So there could be some other explanation in that regard. For instance, the company's business may be deteriorating.
Additionally, Chemed has paid dividends over a period of at least ten years, which means that the company's management is determined to pay dividends even if it means little to no earnings growth.
Conclusion
Overall, we feel that Chemed certainly does have some positive factors to consider. Yet, the low earnings growth is a bit concerning, especially given that the company has a high rate of return and is reinvesting ma huge portion of its profits. By the looks of it, there could be some other factors, not necessarily in control of the business, that's preventing growth. That being so, the latest analyst forecasts show that the company will continue to see an expansion in its earnings. Are these analysts expectations based on the broad expectations for the industry, or on the company's fundamentals? Click here to be taken to our analyst's forecasts page for the company.
Have feedback on this article? Concerned about the content? Get in touch with us directly. Alternatively, email editorial-team (at) simplywallst.com.
This article by Simply Wall St is general in nature. We provide commentary based on historical data and analyst forecasts only using an unbiased methodology and our articles are not intended to be financial advice. It does not constitute a recommendation to buy or sell any stock, and does not take account of your objectives, or your financial situation. We aim to bring you long-term focused analysis driven by fundamental data. Note that our analysis may not factor in the latest price-sensitive company announcements or qualitative material. Simply Wall St has no position in any stocks mentioned.
Have feedback on this article? Concerned about the content? Get in touch with us directly. Alternatively, email editorial-team@simplywallst.com