
On Wall Street, market gurus come and go. Every few years, there's a new "expert" who gains a following and can influence markets.
One thing that never changes is market principles. The GameStop Corp. (NYSE:GME) chart has a technical lesson, and that's why it's our Stock of the Day.
GameStop's $63 Resistance Level: Stocks tend to hit resistance and reverse when they reach price levels that were previously peaks or tops.
 There are traders and investors who buy at the very top. Many of them come to regret their decision when the price falls soon after. A number of these remorseful buyers decide they made a mistake and want to exit their positions.
But they don't want to lose money.
As a result, traders often decide to sell their shares if the stock ever rallies back up to their buying price. If there are enough of these remorseful buyers placing sell orders at the price level that had been a top or resistance before, it will form resistance at the level again.
As you can see on the chart below, the $63 level has been important for GameStop. A peak formed on Nov. 2, 2021. After a selloff, the shares rallied and reached this level again Nov. 22, 2021.. Once again they reversed and headed lower.
On May 14 of this year, the shares blasted off on the news surrounding Roaring Kitty. The shares were up more than 100%. And once they reached levels around $63, they ran into resistance and reversed.
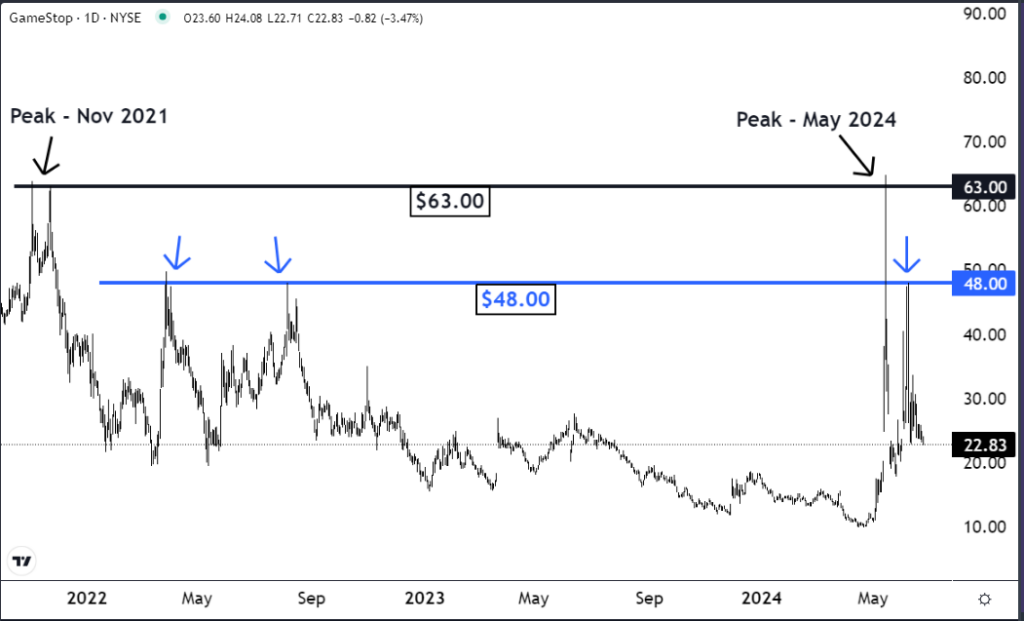
The same type of price action also took place around the important $48 level.
The level was first resistance in March 2022. Then it was resistance again in August 2022.
On June 6 of this year, the stock took off again because of Roaring Kitty and the Reddit community. It ran into resistance around $43 and reversed again.
The Last Word: The term "market memory" refers to the fact that an important price level can retain its importance for a long time, for months or even years.
Sometimes traders have profitable positions but they have a difficult time determining a sell target. It would be logical to consider having it at a price that had previously been a peak or top.
GME Price Action: GameStop shares were trading 1.3% lower Tuesday at $23.34.
Related Link: What's Going On With AMC Entertainment Stock Monday?
Photo via Shutterstock.