
#Gold Technical Analysis# 24K99 news On Tuesday (June 25th), spot gold plummeted sharply in the Asian market, and the gold price is currently at around $2323/ounce, dropping nearly $11 intraday. FXStreet's chief analyst, Valeria Bednarik, analyzed the technical prospects of gold.
Bednarik pointed out that gold trading has shown a weak trend, but the downward trend of gold prices is currently limited.
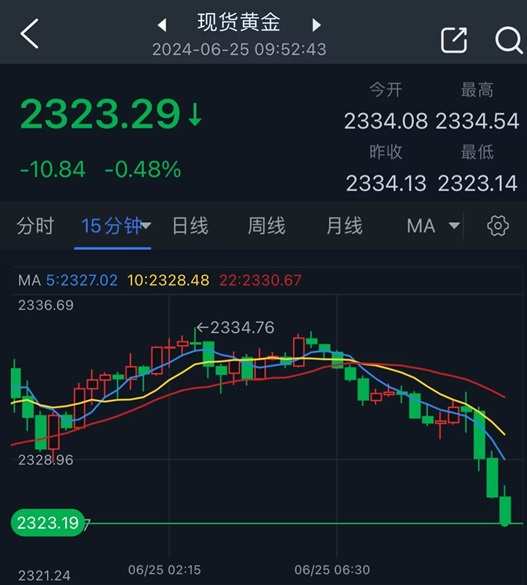
(Source: 24K99) 15-minute chart for spot gold.
Bednarik said that this week, investors' focus will be on the May Personal Consumption Expenditure (PCE) price index in the United States, which is the inflation index preferred by the Federal Reserve. In addition, the upcoming elections in Europe have also made investors cautious.
Boosted by the US dollar's rebound, gold prices rose on Monday. Spot gold rose $12.49, or 0.54%, to close at $2334.13/ounce on Monday.
David Meger, Director of Alternative Investments and Trading at High Ridge Futures Traders, said that gold is in a consolidation mode, with active trading buying on dips, and the market is exploring future interest rate trends and potential rate cuts.
Short-term technical outlook for gold
Bednarik stated that from a technical perspective, according to the daily chart of gold, the prospect of gold is neutral, and the potential for bearishness seems to be very limited. The current gold price is struggling with the directionless 20-day simple moving average (SMA), while the longer-term moving average remains oriented upwards below the current gold price level. At the same time, the technical indicators lack directional strength below the midline, reflecting a lack of speculative interest, rather than implying that the bulls are about to give up.
Bednarik added that in the short term, according to the 4-hour trend chart, the gold price is biased towards neutrality and emptiness. The gold price is developing under all its moving averages, and the 20-period SMA is between the directionless longer-term moving average. At the same time, technical indicators lack directionality below the midline. Last Friday, the gold price fell to a low of $2316.61/ounce. If it falls below this level, the gold price will test the $2300/ounce level.

(Spot gold 4-hour chart source: FXStreet)
Bednarik gave the latest important support and resistance levels for the gold price:
Support level: $2316.60/ounce; $2301.00/ounce; $2288.70/ounce
Resistance level: $2334.10/ounce; $2346.70/ounce; $2360.30/ounce
As of 09:52 Beijing time, spot gold reported $2323.29/ounce.