
Unfortunately for some shareholders, the Applied Optoelectronics, Inc. (NASDAQ:AAOI) share price has dived 27% in the last thirty days, prolonging recent pain. The good news is that in the last year, the stock has shone bright like a diamond, gaining 110%.
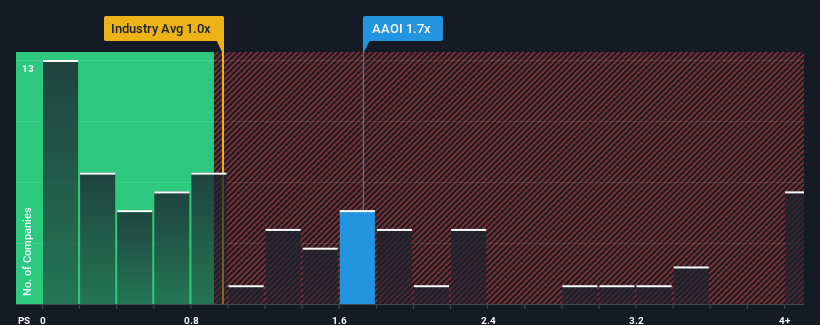
Even after such a large drop in price, given close to half the companies operating in the United States' Communications industry have price-to-sales ratios (or "P/S") below 1x, you may still consider Applied Optoelectronics as a stock to potentially avoid with its 1.7x P/S ratio. However, the P/S might be high for a reason and it requires further investigation to determine if it's justified.
What Does Applied Optoelectronics' P/S Mean For Shareholders?
While the industry has experienced revenue growth lately, Applied Optoelectronics' revenue has gone into reverse gear, which is not great. Perhaps the market is expecting the poor revenue to reverse, justifying it's current high P/S.. However, if this isn't the case, investors might get caught out paying too much for the stock.
Keen to find out how analysts think Applied Optoelectronics' future stacks up against the industry? In that case, our free report is a great place to start.What Are Revenue Growth Metrics Telling Us About The High P/S?
There's an inherent assumption that a company should outperform the industry for P/S ratios like Applied Optoelectronics' to be considered reasonable.
Retrospectively, the last year delivered a frustrating 8.2% decrease to the company's top line. This means it has also seen a slide in revenue over the longer-term as revenue is down 16% in total over the last three years. Accordingly, shareholders would have felt downbeat about the medium-term rates of revenue growth.
Looking ahead now, revenue is anticipated to climb by 54% during the coming year according to the four analysts following the company. With the industry only predicted to deliver 4.4%, the company is positioned for a stronger revenue result.
In light of this, it's understandable that Applied Optoelectronics' P/S sits above the majority of other companies. Apparently shareholders aren't keen to offload something that is potentially eyeing a more prosperous future.
What Does Applied Optoelectronics' P/S Mean For Investors?
Applied Optoelectronics' P/S remain high even after its stock plunged. Typically, we'd caution against reading too much into price-to-sales ratios when settling on investment decisions, though it can reveal plenty about what other market participants think about the company.
We've established that Applied Optoelectronics maintains its high P/S on the strength of its forecasted revenue growth being higher than the the rest of the Communications industry, as expected. At this stage investors feel the potential for a deterioration in revenues is quite remote, justifying the elevated P/S ratio. Unless the analysts have really missed the mark, these strong revenue forecasts should keep the share price buoyant.
You should always think about risks. Case in point, we've spotted 3 warning signs for Applied Optoelectronics you should be aware of, and 1 of them makes us a bit uncomfortable.
It's important to make sure you look for a great company, not just the first idea you come across. So if growing profitability aligns with your idea of a great company, take a peek at this free list of interesting companies with strong recent earnings growth (and a low P/E).
Have feedback on this article? Concerned about the content? Get in touch with us directly. Alternatively, email editorial-team (at) simplywallst.com.
This article by Simply Wall St is general in nature. We provide commentary based on historical data and analyst forecasts only using an unbiased methodology and our articles are not intended to be financial advice. It does not constitute a recommendation to buy or sell any stock, and does not take account of your objectives, or your financial situation. We aim to bring you long-term focused analysis driven by fundamental data. Note that our analysis may not factor in the latest price-sensitive company announcements or qualitative material. Simply Wall St has no position in any stocks mentioned.
Have feedback on this article? Concerned about the content? Get in touch with us directly. Alternatively, email editorial-team@simplywallst.com