
Unfortunately for some shareholders, the Sangamo Therapeutics, Inc. (NASDAQ:SGMO) share price has dived 30% in the last thirty days, prolonging recent pain. The recent drop completes a disastrous twelve months for shareholders, who are sitting on a 63% loss during that time.
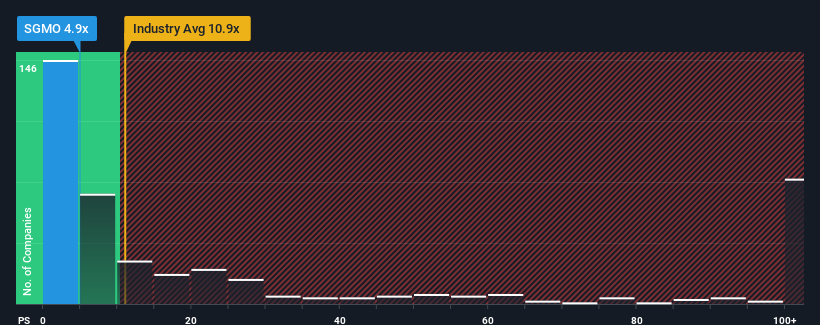
Since its price has dipped substantially, Sangamo Therapeutics may look like a strong buying opportunity at present with its price-to-sales (or "P/S") ratio of 4.9x, considering almost half of all companies in the Biotechs industry in the United States have P/S ratios greater than 10.9x and even P/S higher than 63x aren't out of the ordinary. Nonetheless, we'd need to dig a little deeper to determine if there is a rational basis for the highly reduced P/S.
How Sangamo Therapeutics Has Been Performing
Sangamo Therapeutics could be doing better as its revenue has been going backwards lately while most other companies have been seeing positive revenue growth. The P/S ratio is probably low because investors think this poor revenue performance isn't going to get any better. If you still like the company, you'd be hoping this isn't the case so that you could potentially pick up some stock while it's out of favour.
Want the full picture on analyst estimates for the company? Then our free report on Sangamo Therapeutics will help you uncover what's on the horizon.What Are Revenue Growth Metrics Telling Us About The Low P/S?
There's an inherent assumption that a company should far underperform the industry for P/S ratios like Sangamo Therapeutics' to be considered reasonable.
Taking a look back first, the company's revenue growth last year wasn't something to get excited about as it posted a disappointing decline of 92%. The last three years don't look nice either as the company has shrunk revenue by 86% in aggregate. So unfortunately, we have to acknowledge that the company has not done a great job of growing revenue over that time.
Turning to the outlook, the next three years should generate growth of 81% per year as estimated by the seven analysts watching the company. That's shaping up to be materially lower than the 196% each year growth forecast for the broader industry.
With this in consideration, its clear as to why Sangamo Therapeutics' P/S is falling short industry peers. It seems most investors are expecting to see limited future growth and are only willing to pay a reduced amount for the stock.
What Does Sangamo Therapeutics' P/S Mean For Investors?
Sangamo Therapeutics' P/S looks about as weak as its stock price lately. While the price-to-sales ratio shouldn't be the defining factor in whether you buy a stock or not, it's quite a capable barometer of revenue expectations.
As we suspected, our examination of Sangamo Therapeutics' analyst forecasts revealed that its inferior revenue outlook is contributing to its low P/S. At this stage investors feel the potential for an improvement in revenue isn't great enough to justify a higher P/S ratio. The company will need a change of fortune to justify the P/S rising higher in the future.
Don't forget that there may be other risks. For instance, we've identified 5 warning signs for Sangamo Therapeutics (1 is potentially serious) you should be aware of.
If companies with solid past earnings growth is up your alley, you may wish to see this free collection of other companies with strong earnings growth and low P/E ratios.
Have feedback on this article? Concerned about the content? Get in touch with us directly. Alternatively, email editorial-team (at) simplywallst.com.
This article by Simply Wall St is general in nature. We provide commentary based on historical data and analyst forecasts only using an unbiased methodology and our articles are not intended to be financial advice. It does not constitute a recommendation to buy or sell any stock, and does not take account of your objectives, or your financial situation. We aim to bring you long-term focused analysis driven by fundamental data. Note that our analysis may not factor in the latest price-sensitive company announcements or qualitative material. Simply Wall St has no position in any stocks mentioned.
Have feedback on this article? Concerned about the content? Get in touch with us directly. Alternatively, email editorial-team@simplywallst.com