
#GoldTechnicalAnalysis# 24K99 News: In the Asian market on Thursday (June 20), spot gold suddenly surged in the short term, with the price approaching the $2340/ounce mark, with a daily increase of nearly $11. FXStreet's chief analyst Valeria Bednarik wrote an article analyzing the technical prospects of gold.
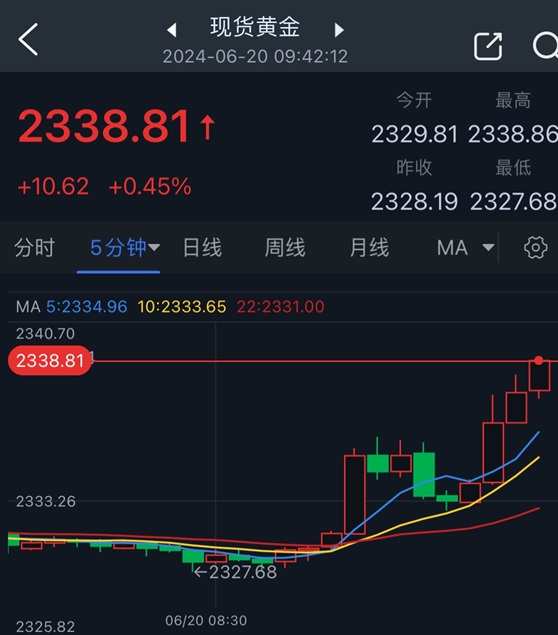
(Spot gold 5-minute chart Source: 24K99)
Previously, spot gold closed basically flat on Wednesday, at $2328.19/ounce.
Bednarik pointed out that the next major event is the Bank of England's monetary policy decision on Thursday, even though the statement's impact on gold prices is often limited. Policy makers must create a huge surprise to really affect gold.
UK inflation data for May met expectations and returned to the 2% target for the first time in three years, but potential price pressures remain strong, which means that the Bank of England may wait longer to cut interest rates.
The market generally expects the Bank of England to maintain interest rates at 5.25%, and most economists polled by Reuters expect the central bank to cut interest rates in August.
On Friday last week, due to signs of cooling US inflation and the heavy blow to the French stock market caused by political turmoil, European stock markets were generally sold and gold prices rose by about 1.3%.
Kinesis Money market analyst Carlo Alberto DeCasa said that as the French and British elections approached, political uncertainty around Europe could be a positive factor.
Fxempire's independent trader and analyst Vladimir Zernov predicts that gold traders are waiting for more catalysts. From a broader perspective, geopolitical tensions continue to support the gold market. If the gold price breaks through the 50-day moving average ($2344), it will move towards resistance levels ($2390-2400/ounce).
Short-term technical outlook for gold
Bednarik said that from a technical point of view, according to the daily chart, the mildly bearish 20-day simple moving average (SMA) constitutes a dynamic resistance. At the same time, technical indicators are stagnant below the midline, reflecting the lack of speculative interest. Finally, the 100-day SMA and 200-day SMA are firmly rising at levels much lower than the current gold price, indicating that any forthcoming decline may be just a correction.
Bednarik added that from the 4-hour trend chart, the short-term outlook for gold is neutral. The mildly bullish 20-period SMA provides intraday support near $2325/ounce. The 200-period SMA line is still far above the current level, lacking directional strength. At the same time, technical indicators remain above the midline and cannot provide directional clues.
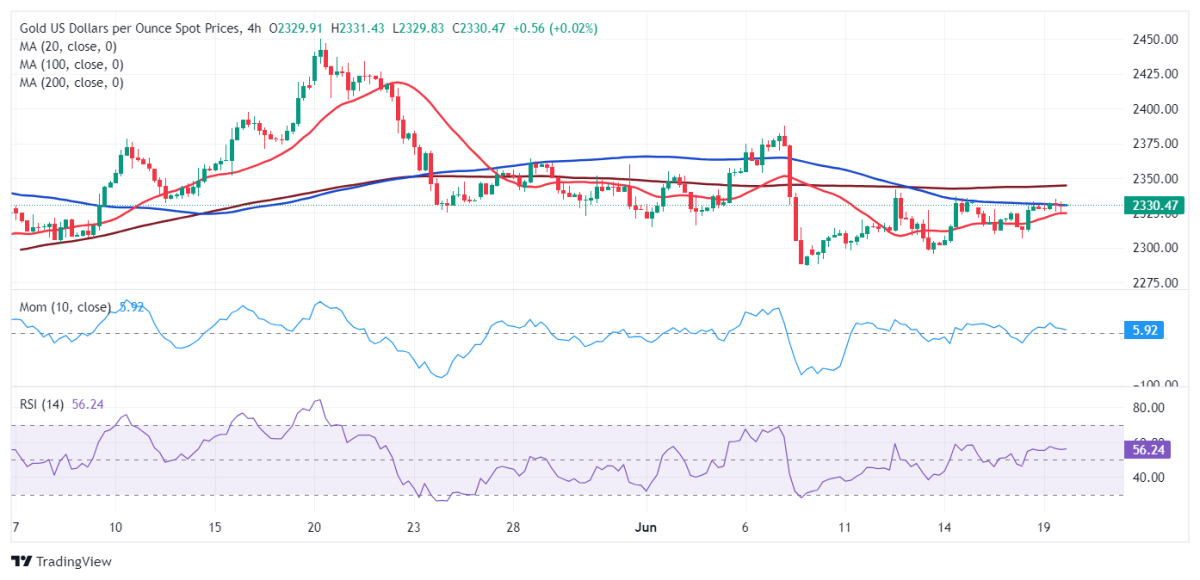
(Spot gold 4-hour chart source: FXStreet)
Bednarik gave the latest important support and resistance levels for the gold price:
Support levels: $2325.00/ounce; $2314.25/ounce; $2298.10/ounce
Resistance levels: $2351.90/ounce; $2366.30/ounce
At 09:42 Beijing time, spot gold was reported at $2338.81/ounce.