
While not a mind-blowing move, it is good to see that the Mandarin Oriental International Limited (SGX:M04) share price has gained 15% in the last three months. But that doesn't change the fact that the returns over the last three years have been less than pleasing. Truth be told the share price declined 11% in three years and that return, Dear Reader, falls short of what you could have got from passive investing with an index fund.
On a more encouraging note the company has added US$76m to its market cap in just the last 7 days, so let's see if we can determine what's driven the three-year loss for shareholders.
Mandarin Oriental International isn't currently profitable, so most analysts would look to revenue growth to get an idea of how fast the underlying business is growing. When a company doesn't make profits, we'd generally hope to see good revenue growth. As you can imagine, fast revenue growth, when maintained, often leads to fast profit growth.
Over three years, Mandarin Oriental International grew revenue at 37% per year. That's well above most other pre-profit companies. The share price drop of 4% per year over three years would be considered disappointing by many, so you might argue the company is getting little credit for its impressive revenue growth. It's possible that the prior share price assumed unrealistically high future growth. Before considering a purchase, investors should consider how quickly expenses are growing, relative to revenue.
The graphic below depicts how earnings and revenue have changed over time (unveil the exact values by clicking on the image).
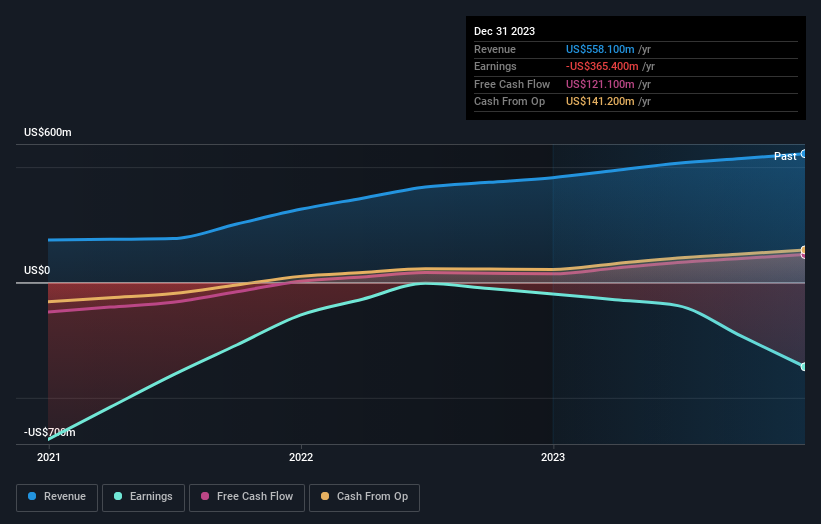
This free interactive report on Mandarin Oriental International's balance sheet strength is a great place to start, if you want to investigate the stock further.
What About Dividends?
It is important to consider the total shareholder return, as well as the share price return, for any given stock. The TSR is a return calculation that accounts for the value of cash dividends (assuming that any dividend received was reinvested) and the calculated value of any discounted capital raisings and spin-offs. It's fair to say that the TSR gives a more complete picture for stocks that pay a dividend. As it happens, Mandarin Oriental International's TSR for the last 3 years was -8.0%, which exceeds the share price return mentioned earlier. This is largely a result of its dividend payments!
A Different Perspective
It's good to see that Mandarin Oriental International has rewarded shareholders with a total shareholder return of 11% in the last twelve months. And that does include the dividend. Since the one-year TSR is better than the five-year TSR (the latter coming in at 1.0% per year), it would seem that the stock's performance has improved in recent times. Someone with an optimistic perspective could view the recent improvement in TSR as indicating that the business itself is getting better with time. While it is well worth considering the different impacts that market conditions can have on the share price, there are other factors that are even more important. Consider for instance, the ever-present spectre of investment risk. We've identified 2 warning signs with Mandarin Oriental International (at least 1 which is potentially serious) , and understanding them should be part of your investment process.
If you would prefer to check out another company -- one with potentially superior financials -- then do not miss this free list of companies that have proven they can grow earnings.
Please note, the market returns quoted in this article reflect the market weighted average returns of stocks that currently trade on Singaporean exchanges.
Have feedback on this article? Concerned about the content? Get in touch with us directly. Alternatively, email editorial-team (at) simplywallst.com.
This article by Simply Wall St is general in nature. We provide commentary based on historical data and analyst forecasts only using an unbiased methodology and our articles are not intended to be financial advice. It does not constitute a recommendation to buy or sell any stock, and does not take account of your objectives, or your financial situation. We aim to bring you long-term focused analysis driven by fundamental data. Note that our analysis may not factor in the latest price-sensitive company announcements or qualitative material. Simply Wall St has no position in any stocks mentioned.
Have feedback on this article? Concerned about the content? Get in touch with us directly. Alternatively, email editorial-team@simplywallst.com