
In order to justify the effort of selecting individual stocks, it's worth striving to beat the returns from a market index fund. But in any portfolio, there are likely to be some stocks that fall short of that benchmark. Unfortunately, that's been the case for longer term Cushman & Wakefield plc (NYSE:CWK) shareholders, since the share price is down 42% in the last three years, falling well short of the market return of around 21%. Unfortunately the share price momentum is still quite negative, with prices down 11% in thirty days.
Now let's have a look at the company's fundamentals, and see if the long term shareholder return has matched the performance of the underlying business.
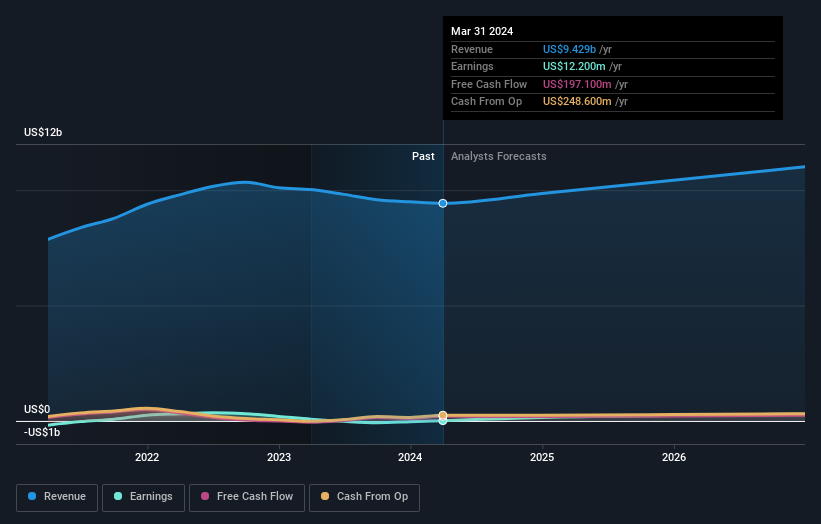
Given that Cushman & Wakefield only made minimal earnings in the last twelve months, we'll focus on revenue to gauge its business development. Generally speaking, we'd consider a stock like this alongside loss-making companies, simply because the quantum of the profit is so low. For shareholders to have confidence a company will grow profits significantly, it must grow revenue.
In the last three years, Cushman & Wakefield saw its revenue grow by 4.6% per year, compound. Given it's losing money in pursuit of growth, we are not really impressed with that. The stock dropped 12% during that time. Shareholders will probably be hoping growth picks up soon. But the real upside for shareholders will be if the company can start generating profits.
You can see how earnings and revenue have changed over time in the image below (click on the chart to see the exact values).
You can see how its balance sheet has strengthened (or weakened) over time in this free interactive graphic.
A Different Perspective
Cushman & Wakefield's TSR for the year was broadly in line with the market average, at 24%. To take a positive view, the gain is pleasing, and it sure beats annualized TSR loss of 7%, which was endured over half a decade. We're pretty skeptical of turnaround stories, but it's good to see the recent share price recovery. It's always interesting to track share price performance over the longer term. But to understand Cushman & Wakefield better, we need to consider many other factors. To that end, you should learn about the 3 warning signs we've spotted with Cushman & Wakefield (including 1 which is significant) .
If you like to buy stocks alongside management, then you might just love this free list of companies. (Hint: many of them are unnoticed AND have attractive valuation).
Please note, the market returns quoted in this article reflect the market weighted average returns of stocks that currently trade on American exchanges.
Have feedback on this article? Concerned about the content? Get in touch with us directly. Alternatively, email editorial-team (at) simplywallst.com.
This article by Simply Wall St is general in nature. We provide commentary based on historical data and analyst forecasts only using an unbiased methodology and our articles are not intended to be financial advice. It does not constitute a recommendation to buy or sell any stock, and does not take account of your objectives, or your financial situation. We aim to bring you long-term focused analysis driven by fundamental data. Note that our analysis may not factor in the latest price-sensitive company announcements or qualitative material. Simply Wall St has no position in any stocks mentioned.
Have feedback on this article? Concerned about the content? Get in touch with us directly. Alternatively, email editorial-team@simplywallst.com