
To the annoyance of some shareholders, Mersana Therapeutics, Inc. (NASDAQ:MRSN) shares are down a considerable 25% in the last month, which continues a horrid run for the company. Instead of being rewarded, shareholders who have already held through the last twelve months are now sitting on a 41% share price drop.
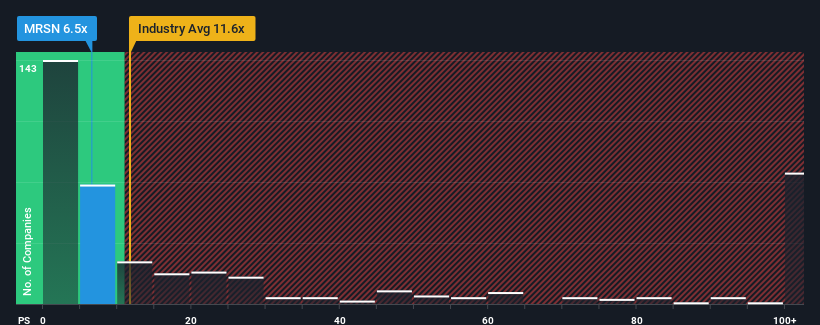
Following the heavy fall in price, Mersana Therapeutics may be sending bullish signals at the moment with its price-to-sales (or "P/S") ratio of 6.5x, since almost half of all companies in the Biotechs industry in the United States have P/S ratios greater than 11.6x and even P/S higher than 64x are not unusual. Although, it's not wise to just take the P/S at face value as there may be an explanation why it's limited.
What Does Mersana Therapeutics' Recent Performance Look Like?
With revenue growth that's inferior to most other companies of late, Mersana Therapeutics has been relatively sluggish. Perhaps the market is expecting the current trend of poor revenue growth to continue, which has kept the P/S suppressed. If you still like the company, you'd be hoping revenue doesn't get any worse and that you could pick up some stock while it's out of favour.
Keen to find out how analysts think Mersana Therapeutics' future stacks up against the industry? In that case, our free report is a great place to start.What Are Revenue Growth Metrics Telling Us About The Low P/S?
There's an inherent assumption that a company should underperform the industry for P/S ratios like Mersana Therapeutics' to be considered reasonable.
Taking a look back first, we see that the company grew revenue by an impressive 18% last year. This great performance means it was also able to deliver immense revenue growth over the last three years. So we can start by confirming that the company has done a tremendous job of growing revenue over that time.
Turning to the outlook, the next three years should bring diminished returns, with revenue decreasing 7.1% per annum as estimated by the nine analysts watching the company. With the industry predicted to deliver 203% growth per annum, that's a disappointing outcome.
With this information, we are not surprised that Mersana Therapeutics is trading at a P/S lower than the industry. Nonetheless, there's no guarantee the P/S has reached a floor yet with revenue going in reverse. Even just maintaining these prices could be difficult to achieve as the weak outlook is weighing down the shares.
What We Can Learn From Mersana Therapeutics' P/S?
The southerly movements of Mersana Therapeutics' shares means its P/S is now sitting at a pretty low level. Generally, our preference is to limit the use of the price-to-sales ratio to establishing what the market thinks about the overall health of a company.
As we suspected, our examination of Mersana Therapeutics' analyst forecasts revealed that its outlook for shrinking revenue is contributing to its low P/S. At this stage investors feel the potential for an improvement in revenue isn't great enough to justify a higher P/S ratio. Unless these conditions improve, they will continue to form a barrier for the share price around these levels.
It's always necessary to consider the ever-present spectre of investment risk. We've identified 3 warning signs with Mersana Therapeutics, and understanding them should be part of your investment process.
It's important to make sure you look for a great company, not just the first idea you come across. So if growing profitability aligns with your idea of a great company, take a peek at this free list of interesting companies with strong recent earnings growth (and a low P/E).
Have feedback on this article? Concerned about the content? Get in touch with us directly. Alternatively, email editorial-team (at) simplywallst.com.
This article by Simply Wall St is general in nature. We provide commentary based on historical data and analyst forecasts only using an unbiased methodology and our articles are not intended to be financial advice. It does not constitute a recommendation to buy or sell any stock, and does not take account of your objectives, or your financial situation. We aim to bring you long-term focused analysis driven by fundamental data. Note that our analysis may not factor in the latest price-sensitive company announcements or qualitative material. Simply Wall St has no position in any stocks mentioned.
Have feedback on this article? Concerned about the content? Get in touch with us directly. Alternatively, email editorial-team@simplywallst.com