
GrafTech International Ltd. (NYSE:EAF) shareholders that were waiting for something to happen have been dealt a blow with a 41% share price drop in the last month. The recent drop completes a disastrous twelve months for shareholders, who are sitting on a 80% loss during that time.
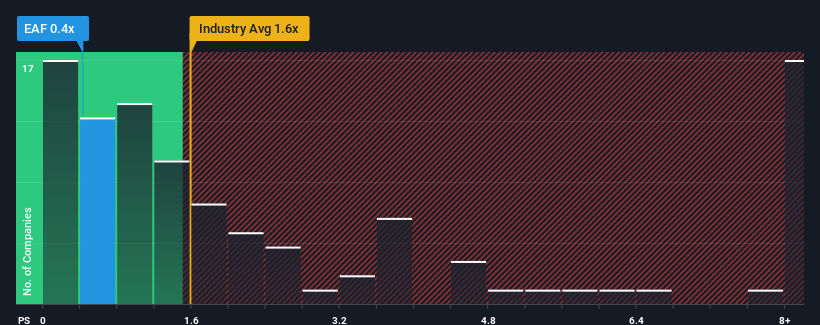
Since its price has dipped substantially, GrafTech International's price-to-sales (or "P/S") ratio of 0.4x might make it look like a buy right now compared to the Electrical industry in the United States, where around half of the companies have P/S ratios above 1.6x and even P/S above 4x are quite common. However, the P/S might be low for a reason and it requires further investigation to determine if it's justified.
How GrafTech International Has Been Performing
GrafTech International hasn't been tracking well recently as its declining revenue compares poorly to other companies, which have seen some growth in their revenues on average. It seems that many are expecting the poor revenue performance to persist, which has repressed the P/S ratio. If this is the case, then existing shareholders will probably struggle to get excited about the future direction of the share price.
If you'd like to see what analysts are forecasting going forward, you should check out our free report on GrafTech International.How Is GrafTech International's Revenue Growth Trending?
In order to justify its P/S ratio, GrafTech International would need to produce sluggish growth that's trailing the industry.
Taking a look back first, the company's revenue growth last year wasn't something to get excited about as it posted a disappointing decline of 41%. This means it has also seen a slide in revenue over the longer-term as revenue is down 49% in total over the last three years. So unfortunately, we have to acknowledge that the company has not done a great job of growing revenue over that time.
Looking ahead now, revenue is anticipated to slump, contracting by 11% during the coming year according to the five analysts following the company. Meanwhile, the broader industry is forecast to expand by 13%, which paints a poor picture.
In light of this, it's understandable that GrafTech International's P/S would sit below the majority of other companies. Nonetheless, there's no guarantee the P/S has reached a floor yet with revenue going in reverse. Even just maintaining these prices could be difficult to achieve as the weak outlook is weighing down the shares.
What Does GrafTech International's P/S Mean For Investors?
GrafTech International's P/S has taken a dip along with its share price. Using the price-to-sales ratio alone to determine if you should sell your stock isn't sensible, however it can be a practical guide to the company's future prospects.
As we suspected, our examination of GrafTech International's analyst forecasts revealed that its outlook for shrinking revenue is contributing to its low P/S. As other companies in the industry are forecasting revenue growth, GrafTech International's poor outlook justifies its low P/S ratio. Unless there's material change, it's hard to envision a situation where the stock price will rise drastically.
And what about other risks? Every company has them, and we've spotted 2 warning signs for GrafTech International (of which 1 can't be ignored!) you should know about.
If you're unsure about the strength of GrafTech International's business, why not explore our interactive list of stocks with solid business fundamentals for some other companies you may have missed.
Have feedback on this article? Concerned about the content? Get in touch with us directly. Alternatively, email editorial-team (at) simplywallst.com.
This article by Simply Wall St is general in nature. We provide commentary based on historical data and analyst forecasts only using an unbiased methodology and our articles are not intended to be financial advice. It does not constitute a recommendation to buy or sell any stock, and does not take account of your objectives, or your financial situation. We aim to bring you long-term focused analysis driven by fundamental data. Note that our analysis may not factor in the latest price-sensitive company announcements or qualitative material. Simply Wall St has no position in any stocks mentioned.
Have feedback on this article? Concerned about the content? Get in touch with us directly. Alternatively, email editorial-team@simplywallst.com