
Analyst discussions about the "poor breadth" of the U.S. stock market seem to have reached a climax.
Last week, as the stock prices of tech giants rose and the gains of other listed companies in the US fell behind, the gap between the S&P 500 market cap-weighted index and the S&P 500 equal weight index reached a new significant extreme.
According to Dow Jones market data, the S&P 500 index has exceeded the S&P 500 equal weight index by 2% or more for two consecutive weeks, the first time this has occurred since records began in 1990.
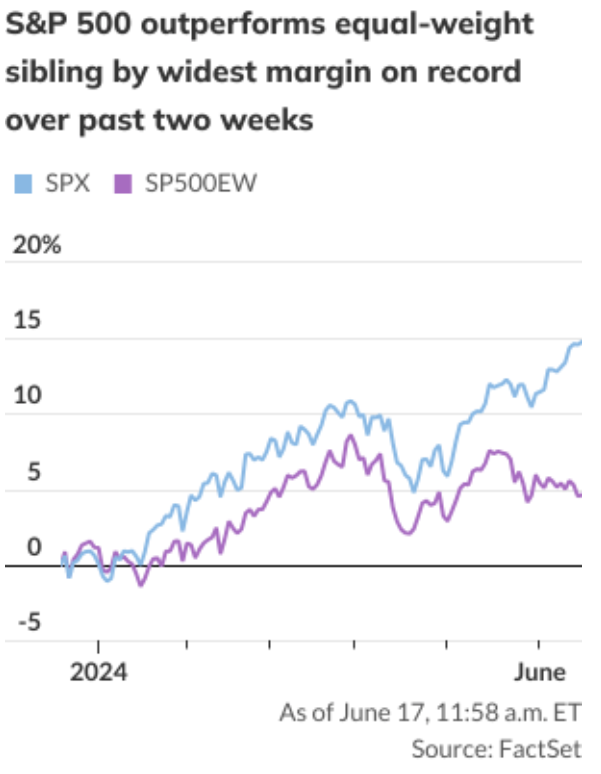
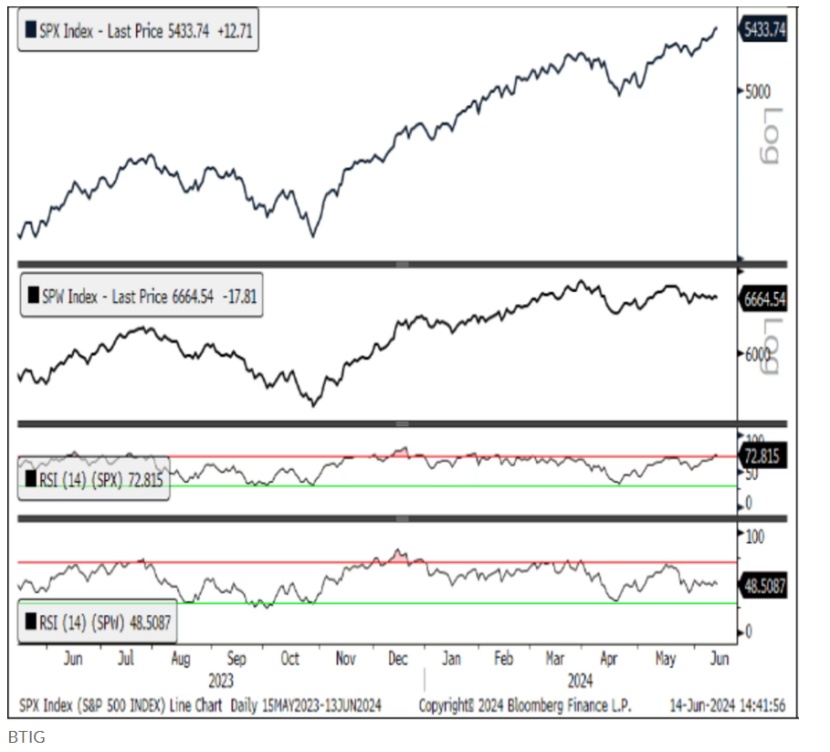
But this is not the only milestone that indicates the divergence between the two indices has intensified. According to Jonathan Krinsky, BTIG's chief market technician analyst, the relative strength index (RSI) of the S&P 500 index was above 70 last Thursday, while the RSI of the S&P 500 equal weight index was below 50 for the first time on the same day, and the latter again closed below 50 on Friday.
Krinsky explained that the difference in RSI indicators between the two indices is significant. RSI is a momentum indicator used by many technical analysts. A reading above 70 indicates that a specific index or security is overbought, while a low reading below 50 is an oversold signal.
The divergence of these two indicators seems to be developing in opposite directions, which is the latest sign of deepening market segmentation in the US.
In addition, the percentage of constituent stocks in the S&P 500 index trading above the 50-day moving average has fallen below 50%, while the index itself continues to be more than 4% above the mid-term average.
Krinsky said this has not happened since December 1999.

The 'poor breadth' of the US stock market has been widely discussed among investment professionals over the past year.
But last week, analysts seemed to have reached a climax in the discussion. Many cited various indicators showing that the divergence beneath the S&P 500 index has reached a new extreme. According to FactSet data, only a few stocks contributed to the S&P 500's new high last week.
Bespoke Investment Group analysts provided more evidence on Monday that the S&P 500 index no longer reflects the overall performance of its constituent stocks.
The cumulative ups and downs of the index over the past year have failed to reach a new high this year with the index. Instead, the difference between the number of stocks trending up and down in the S&P 500 index has continued to widen.
At the close of last week, the number of constituent stocks in the S&P 500 index hitting 52-week lows was more than those hitting 52-week highs.
Finally, although the S&P 500 index is still firmly in the overbought zone, the overbought level of the S&P 500 Information Technology sector is even higher, with the difference between the 50-day moving averages of the two being the highest in the past year.
But even within the Information Technology sector, breadth has recently deteriorated, a sign that the influence of a few large-cap stocks is increasingly expanding. Recently, less than 65% of companies in the sector have been trading above their 50-day moving averages, far below the level at the beginning of the year.
Edited by Jeffrey