
Source: Wall Street See
The red light of the bear market is gradually turning on. Bank of America Merrill Lynch summarizes the top 10 indicators of the stock market's peak, and the current indicator trigger progress has reached 40%. The bull market will peak when the average reaches 70%.
With the help of Star Tech Stocks in US stock, the S&P 500 Index hit a new high again. As an optimist, Goldman Sachs has once again raised its year-end target price for the S&P 500 Index, with the maximum upside to 6300.
Contrary to the bullish sentiment on Wall Street, Bank of America Merrill Lynch warns that the US stock market may top out as its observation of the top 10 indicators for topping has already lit up 40% of the "red lights".
These top ten indicators cover areas such as "optimistic sentiment", "market valuation", "macro-economy", and "credit contraction".
The "red light" for the top of the S&P 500 Index has already lit up.
On June 14th, Bank of America Merrill Lynch analysts Savita Subramanian et al. stated in a research report that when the S&P 500 Index continues to break through its previous high, the volatility index (VIX) continues to decline, and the spread between credit and loans tightens, it reminds people of the calm before the storm.
In Bank of America Merrill Lynch's database, the top ten indicators often appear before the US stock market tops out. As of May 2024, when the S&P 500 Index was at 5278 points, four of the ten indicators had been triggered. The progress bar for the top signal is 40%, and the bull market will top out when the average reaches 70%.
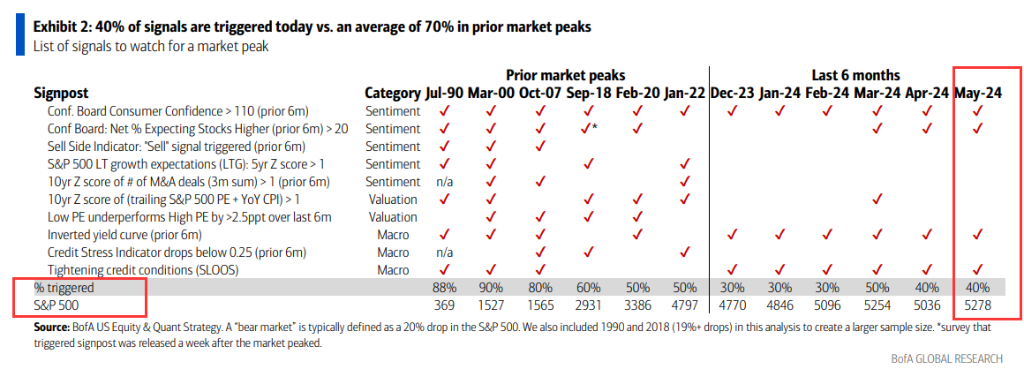
The specific performance of the top ten indicators:
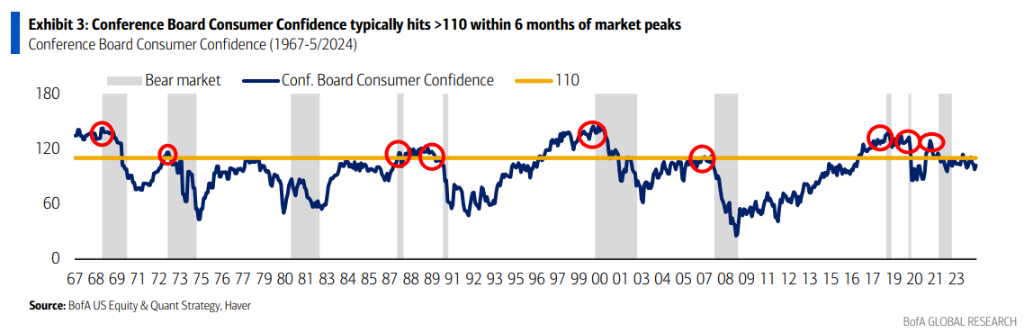
1. Consumer confidence index. Within six months before the stock market tops out, The Conference Board's consumer confidence index usually reaches over 110. In January 2024, the value reached 111, triggering the indicator. The following chart shows that the market will turn bearish after the index exceeds 110.
2. Bear market net sentiment. According to a survey by The Conference Board of large-scale enterprises, situations where the net sentiment is higher than 20% usually occur within six months before the market tops out. Currently, 48% of consumers expect prices to rise in the next 12 months, 25% expect prices to fall, and the net sentiment is 23%, triggering the indicator.

3. Sell-side indicator. Bank of America Merrill Lynch's Sell-Side Indicator (SSI) tracks the average recommended allocation of stocks by Wall Street strategists. The bank stated that extreme bearishness in Wall Street is a bullish signal, and vice versa. In three of the last six bear markets, the SSI has issued a "sell" signal within six months before the stock market tops out. The current SSI is in the "neutral" area, roughly between the "buy" and "sell" signals, so the indicator has not been triggered.

4. Long-term growth expectations. Similar to the Sell-Side Indicator, the long-term growth (LTG) expectations of sell-side fundamental analysts for S&P 500 component stocks are often negatively correlated with subsequent returns. Higher expectations are more likely to disappoint the stock market, and vice versa. In the previous six market peaks, the long-term return expectations of the S&P 500 Index were more than 1 standard deviation above their 5-year averages in 4 times. In the past year and a half, the expected return has been rising, but it is still low (only 0.2 standard deviation higher than the 1-year average level). The indicator has not been triggered.

5. Increased merger and acquisition activity. Before the bear market, the number of mergers and acquisitions usually steadily increases. Within six months before the market tops out, the number of mergers and acquisitions (3 million) is more than 1 standard deviation above the 10-year average level. In the past 12 months, merger and acquisition activities have increased, but still far below the threshold. Therefore, the indicator has not been triggered.

6. Market valuation, high P/E ratio + high CPI. Valuation and CPI are basically inversely related, and higher inflation often depresses valuation. The S&P 500 Index usually tops out when the sum of the P/E ratio and CPI is more than 1 standard deviation above the 10-year average level. The current tracking P/E ratio is 24, and CPI is 3.3% (sum = 27), which is 0.9 standard deviation higher than the average level and slightly lower than the threshold.

7. Performance: Expensive stocks vs. cheap stocks. In a bull market, the performance of low P/E ratio stocks usually outperforms that of high P/E ratio stocks. However, the opposite often occurs before the market tops out, and high P/E ratio stocks rebound. In the past 7 market tops, low P/E ratio stocks underperformed high P/E ratio stocks by at least 2.5%. However, this indicator has not been triggered.

8. Macroeconomy - Slope of the Yield Curve. The inverted yield curve (long-term interest rates lower than short-term interest rates) indicates weakened growth expectations. In the previous 8 bear markets, the yield curve inverted within the past 6 months in 5 cases. Since July 2022, the yield curve has been inverted, which is the longest duration of inversion on record. The indicator has been triggered.

9. Credit stress indicators (CSI). This indicator often drops sharply before the stock market peak. In the past five times when the market turned from a bull to a bear, this indicator has fallen below 0.25 three times. Currently, the indicator has not been triggered and the value is 0.39.

10. Credit tightening indicators. According to data from the "Senior Loan Officer Opinion Survey", banks usually begin to tighten loan standards before the market peak. As of the first quarter of this year, 16% of banks have tightened credit, and this indicator has been triggered.

Goldman Sachs raises year-end target price for S&P 500 index
Compared to the caution of Bank of America Merrill Lynch, Goldman Sachs analysts are more optimistic about the S&P 500 index.
Last Friday (June 14), the Goldman Sachs strategy team led by David Kostin said in a report that due to "below-average negative earnings revisions and higher fair value P/E ratio," it is currently expected that the benchmark scenario will lead to the S&P 500 index rising to 5,600 points in 2024, which is higher than the previous forecast of 5,200 points, and set a new historical high. Goldman Sachs has raised its year-end target price for the S&P 500 index in February this year and December 2023.
Currently, Goldman Sachs' view is consistent with Brian Belski of BMO Capital Markets, who raised his target price for the S&P 500 index to 5,600 points in May, making him one of the most optimistic bulls on Wall Street at the time.
However, Goldman Sachs' trading chief also pointed out that the continued highs of the US stock market rely on technology stocks, but the market risk lies in consumer end. Goldman Sachs said that although the US stock market has been hitting new highs, the expected growth of the US economy is too optimistic. The most easily overlooked factor is the financial deterioration and consumption decline of middle and low-end consumers. Although inflation is easing, price levels are still challenging for consumers.
Editor/tolk