
#Gold Technical Analysis# 24K99 News On Monday (June 17th), despite the weak U.S. dollar, spot gold still significantly declined and the price once fell below 2310 U.S. dollars/ounce.
FXStreet analyst Christian Borjon Valencia pointed out on Tuesday that gold's outlook this week is not favorable due to the high rise in U.S. bond yields weakening the market's interest in this non-interest-bearing asset.
The U.S. dollar index closed down 0.16% on Monday at 105.34.
Spot gold fell 13.09 dollars, or 0.56%, to close at 2319.01 U.S. dollars per ounce on Monday. The lowest price of gold during the session touched 2309.87 U.S. dollars/ounce.
Federal Reserve officials decided last week to keep interest rates unchanged and to modify their expectation of cutting interest rates three times later this year to once.
Valencia stated that due to the hawkish stance of Federal Reserve officials, the rise in U.S. Treasury yields has put gold on the defensive. U.S. 10-year Treasury notes yield rose nearly 6 basis points on Monday to 4.281%.
Fxempire independent trader and analyst Vladimir Zernov predicts that gold is under pressure due to traders' focus on the rise in U.S. Treasury yields.
Last weekend, Minneapolis Federal Reserve Chairman Neel Kashkari stated that the Federal Reserve will wait until December to cut interest rates. Rate cuts will reduce the opportunity cost of holding gold and increase its attractiveness to investors.
Kashkari said in an interview, "We need to see more evidence to convince us that the inflation rate is on track to fall to 2%."
Kashkari said that the Fed is in a favorable position, but if there is only one interest rate cut as shown by the median, it is likely to be at the end of this year.
Valencia stated that upcoming U.S. economic data, including retail sales and industrial production, will affect the price of gold.
Kitco Metals senior market analyst Jim Wyckoff said: "The gold market does lack significant new fundamental news, so it is looking outward to the external markets for direction. Gold may consolidate in a range of $2,300 to $2,400 until the next major fundamental catalyst appears, which may not happen until sometime in July."
In addition, traders are closely watching comments from New York Federal Reserve Chairman John Williams, Philadelphia Federal Reserve Chairman Patrick Harker, and Federal Reserve Board member Lisa Cook.
The United States will release retail sales data on Tuesday, initial jobless claims for last week on Thursday, and the initial value of the Purchasing Managers Index (PMI) on Friday, all of which are expected to give investors a clearer view of current consumption and economic strength.
How to trade after a significant gold pullback?
Valencia pointed out that due to maintaining a complete head and shoulders pattern, gold's outlook is neutral to bearish. The momentum indicator shows that as the relative strength index (RSI) falls further into the bearish zone, sellers are accumulating power and opening the door for further declines.
Valencia stated that if the price of gold falls below $2,300/ounce, the first support level will be the low point of $2,277/ounce on May 3, followed by the high point of $2,222/ounce on March 21.
If gold falls below the above levels, the price of gold will have further downward potential, and sellers may focus on the target price of the head and shoulders pattern between $2,170/ounce and $2,160/ounce.
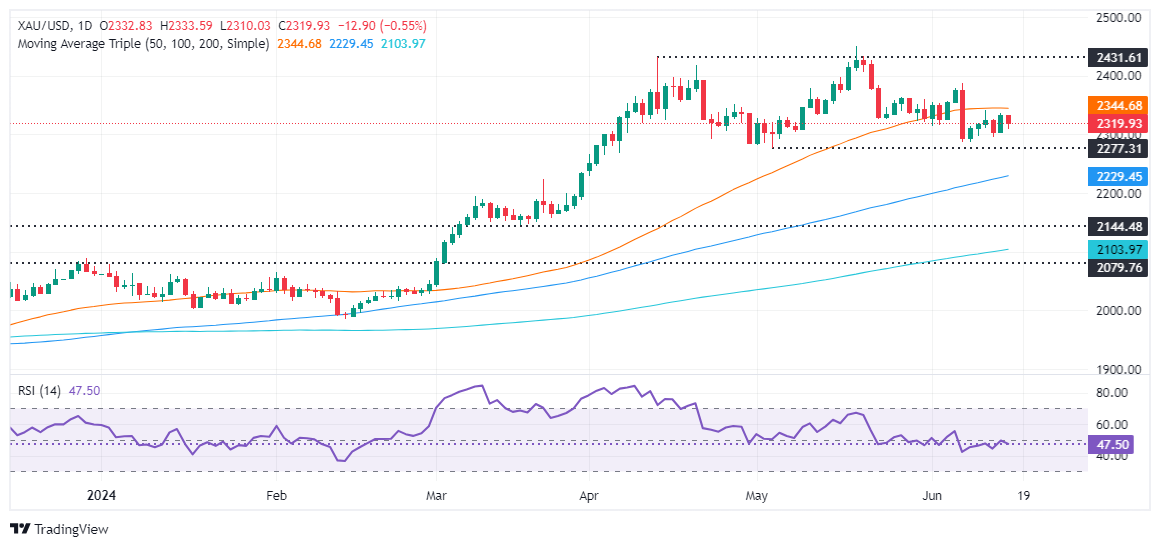
(Spot gold daily chart source: FXStreet)
Valencia added that if the price of gold rebounds and breaks through the June 7th cycle high of $2,387/ounce, then the price of gold will be ready to test the key level of $2,400/ounce.
Economies.com, a well-known financial website, wrote on Monday that the decline in gold prices and the continuing negative signal of the stochastic indicator have led to the continuation of the bearish trend scenario. The price of gold is trading below the 50-period exponential moving average (EMA), which supports the bearish outlook, and the main target for the price of gold is $2,272.06/ounce, which can be realized if the price of gold remains below $2,340.10/ounce.
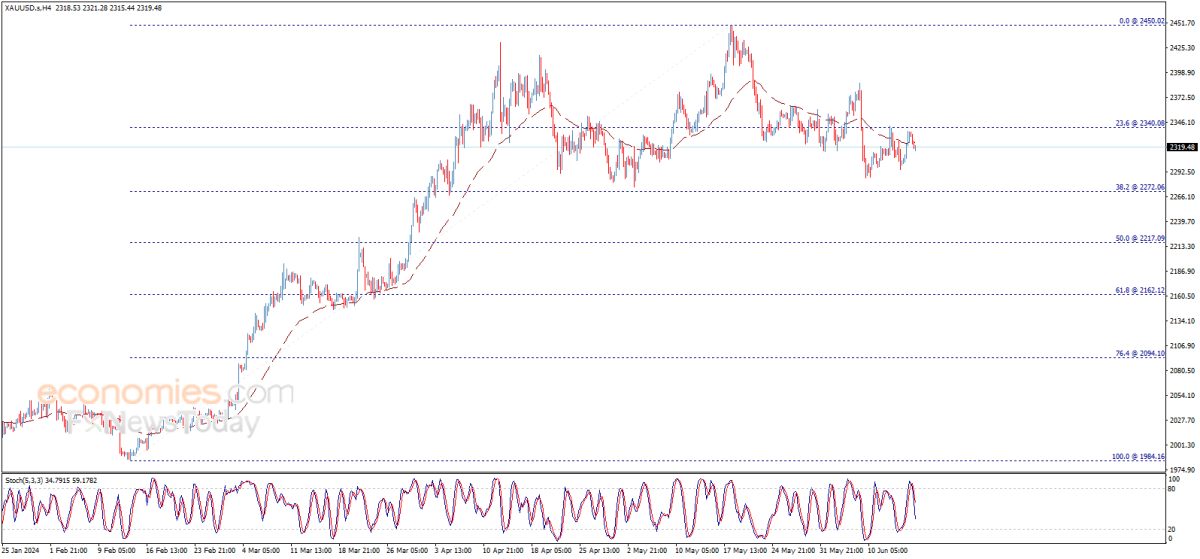
(Spot gold 4-hour chart Source: Economies.com)