
 Menghani写道,黄金价格难以利用上周五的积极走势,并在新一周的第一天吸引新的卖家。黄金价格目前低于2325美元/盎司。美联储上周出人意料的鹰派预测,2024年只会降息一次,这支持美国国债收益率的上升,并令美元保持在5月初以来的最高水平附近,对黄金价格施加一些下行压力。
#Gold Technical Analysis# 24K99 News On Monday (June 17th), spot gold failed to continue its strong momentum from the previous trading day and saw a significant pullback in price, currently falling to around $2322/ounce, with a daily decline of nearly $10. FXStreet analyst Haresh Menghani analyzed the technical trends of gold price in his latest article on Monday.
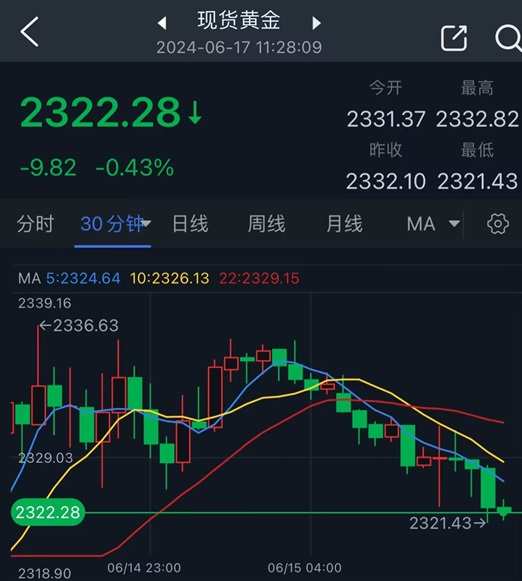
(Spot gold 30-minute chart, source: 24K99)
Spot gold closed up 1.23% at $2332.10 per ounce on Friday. The price of gold soared $38.36 at the end of last week, an increase of 1.67%.
 Menghani wrote that gold prices have struggled to take advantage of Friday's positive momentum and attracted new sellers on the first day of the new week. Gold prices are currently below $2325/ounce. The unexpectedly hawkish Fed prediction last week that interest rates will only be cut once in 2024 supported the rise in US Treasury yields and kept the dollar near its highest level since early May, putting some downward pressure on gold prices.
Minneapolis Fed President Neel Kashkari said on Sunday that we need to see more evidence that inflation is approaching 2%, and the Fed will wait until December to cut interest rates.
However, Menghani said that the ongoing geopolitical tensions in the Middle East, coupled with political uncertainty in Europe, may provide some support for safe-haven gold prices and help limit further declines in gold prices.
The latest technical outlook for gold
Menghani pointed out that from a technical perspective, traders need to wait for the price of gold to fall below the key level of $2300/ounce, and then make new bearish bets around the price of gold. Therefore, the cautious approach is to wait for the price of gold to encounter some follow-up selling and fall below the support level of $2285/ounce, and then lay out for further declines in the price of gold.
After that, the gold price may accelerate its decline to the next support level of around $2254-2253/ounce. The downward trajectory may further extend to the $2225-2220/ounce area, eventually reaching $2200/ounce.
On the other hand, Menghani added that the 50-day simple moving average line (currently near the $2344-2345/ounce area) may form a short-term strong obstacle. This is followed by the resistance area of $2360-2362/ounce. If this area is decisively cleared, it may trigger some short-covering rebounds and push the gold price up to the middle resistance level of $2387-2388/ounce, thus advancing towards the key level of $2400/ounce.
After that, if the gold price continues to break through $2400/ounce, it will eliminate the recent bearish trend and allow the gold price to challenge the historical high level (near $2450/ounce touched in May).
At 11:28 Beijing time, spot gold was reported at $2322.28/ounce.