
#Gold Technical Analysis # 24K99 News On Monday (June 17th), spot gold suddenly fluctuated in the Asian market, and the price of gold plummeted to around $2322 per ounce, then bounced back quickly and is currently located around $2328 per ounce. Nicholas Kitonyi, a well-known financial website FXDailyReport analyst, wrote an article analyzing the future trend of gold.
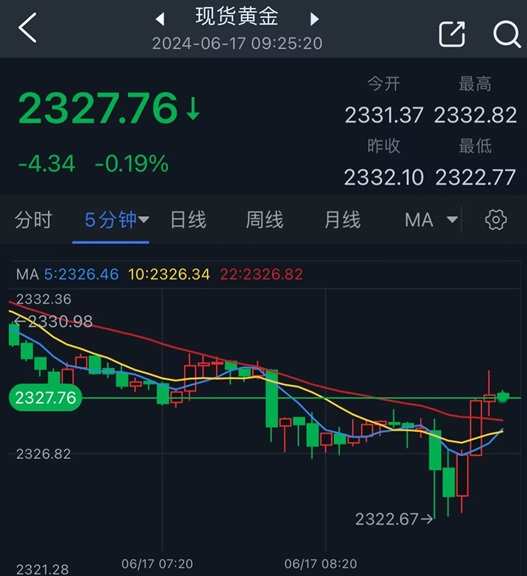
(Spot gold 5-minute chart Source: 24K99)
Kitonyi wrote in the article that on the 60-minute chart, the price of gold continues to trade within the upward channel. The price of gold has now risen above the 100-hour moving average. Therefore, gold seems to be entering an overbought level of the 14-hour relative strength index (RSI).
Spot gold closed up 1.23% at $2332.10 per ounce on Friday. The price of gold soared $38.36 at the end of last week, an increase of 1.67%.
James Stanley, senior market strategist at Forex.com, said that geopolitical uncertainty and rising debt levels dominate the fundamental outlook for gold. However, he added, the short-term technical outlook is a bit unstable because the price trend is forming a head and shoulders pattern, with the neckline support zone between $2,300 and $2,275.
Stanley added that if the gold price falls below his initial support level, he would not be surprised to see the gold price fall all the way to $2,100 and retest the key support level of $2,075.
Alex Kuptsikevich, senior market analyst at FxPro, said that although the price of gold successfully held the support level of $2,300 in the past two tests, this level looks a bit fragile. He pointed out that the dual factors of a weak stock market and a strong dollar may give some resistance to precious metals in the short term.
Two pictures of the technical prospects of gold
Regarding the short-term trend, Kitonyi said that from a technical point of view, the price of gold is trading within an upward channel on the 60-minute chart. The 14-hour relative strength index (RSI) also seems to support the current bullish trend because it is close to overbought.
Therefore, the current target of gold bulls is for the price of gold to rise to $2348 or higher, $2363 per ounce. On the other hand, gold shorts will target short-term profit targets at around $2313 per ounce or lower, $2297 per ounce.
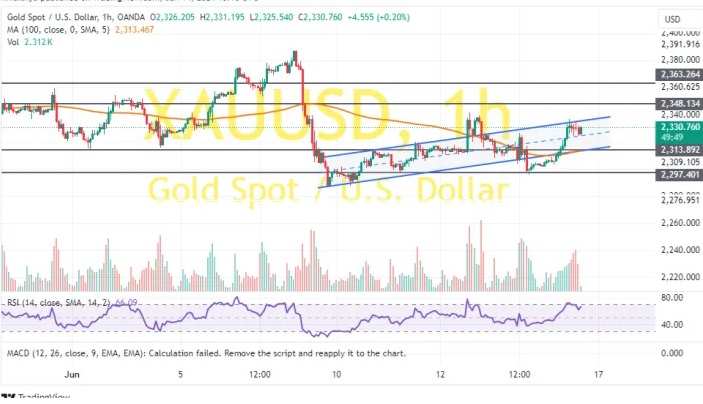
(Spot gold 60-minute chart source: FXDailyReport)
Kitonyi pointed out that on the daily chart, the price of gold is trading within a downward channel. However, the 14-day RSI appears to have plenty of room to run before reaching oversold conditions.
Therefore, gold shorts will seek to continue the downward trend of gold and fall to $2286 per ounce or lower, $2230 per ounce. On the other hand, gold bulls will seek to profit from the rebound in the price of gold to around $2377 per ounce or higher, $2429 per ounce.

(Spot gold daily chart source: FXDailyReport)
At 09:25 Beijing time, spot gold was reported at $2327.76 per ounce.