
Warren Buffett famously said, 'Volatility is far from synonymous with risk.' When we think about how risky a company is, we always like to look at its use of debt, since debt overload can lead to ruin. As with many other companies ICON Public Limited Company (NASDAQ:ICLR) makes use of debt. But is this debt a concern to shareholders?
When Is Debt Dangerous?
Debt is a tool to help businesses grow, but if a business is incapable of paying off its lenders, then it exists at their mercy. Part and parcel of capitalism is the process of 'creative destruction' where failed businesses are mercilessly liquidated by their bankers. However, a more common (but still painful) scenario is that it has to raise new equity capital at a low price, thus permanently diluting shareholders. Of course, the upside of debt is that it often represents cheap capital, especially when it replaces dilution in a company with the ability to reinvest at high rates of return. The first step when considering a company's debt levels is to consider its cash and debt together.
What Is ICON's Debt?
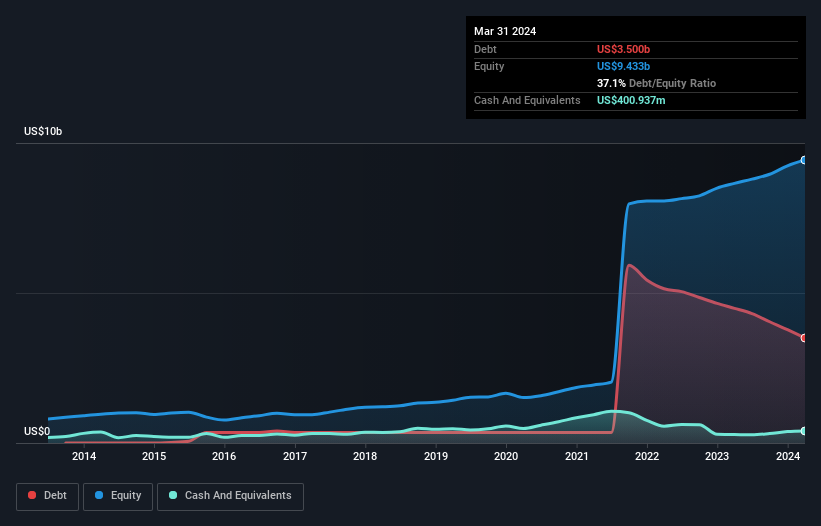
As you can see below, ICON had US$3.50b of debt at March 2024, down from US$4.49b a year prior. However, it does have US$400.9m in cash offsetting this, leading to net debt of about US$3.10b.
A Look At ICON's Liabilities
The latest balance sheet data shows that ICON had liabilities of US$2.95b due within a year, and liabilities of US$4.67b falling due after that. Offsetting this, it had US$400.9m in cash and US$3.00b in receivables that were due within 12 months. So its liabilities outweigh the sum of its cash and (near-term) receivables by US$4.21b.
Given ICON has a humongous market capitalization of US$26.2b, it's hard to believe these liabilities pose much threat. Having said that, it's clear that we should continue to monitor its balance sheet, lest it change for the worse.
We use two main ratios to inform us about debt levels relative to earnings. The first is net debt divided by earnings before interest, tax, depreciation, and amortization (EBITDA), while the second is how many times its earnings before interest and tax (EBIT) covers its interest expense (or its interest cover, for short). The advantage of this approach is that we take into account both the absolute quantum of debt (with net debt to EBITDA) and the actual interest expenses associated with that debt (with its interest cover ratio).
ICON has net debt worth 1.8 times EBITDA, which isn't too much, but its interest cover looks a bit on the low side, with EBIT at only 3.5 times the interest expense. While these numbers do not alarm us, it's worth noting that the cost of the company's debt is having a real impact. If ICON can keep growing EBIT at last year's rate of 20% over the last year, then it will find its debt load easier to manage. When analysing debt levels, the balance sheet is the obvious place to start. But ultimately the future profitability of the business will decide if ICON can strengthen its balance sheet over time. So if you want to see what the professionals think, you might find this free report on analyst profit forecasts to be interesting.
Finally, a business needs free cash flow to pay off debt; accounting profits just don't cut it. So we always check how much of that EBIT is translated into free cash flow. During the last three years, ICON generated free cash flow amounting to a very robust 91% of its EBIT, more than we'd expect. That positions it well to pay down debt if desirable to do so.
Our View
ICON's conversion of EBIT to free cash flow suggests it can handle its debt as easily as Cristiano Ronaldo could score a goal against an under 14's goalkeeper. But truth be told we feel its interest cover does undermine this impression a bit. When we consider the range of factors above, it looks like ICON is pretty sensible with its use of debt. While that brings some risk, it can also enhance returns for shareholders. Above most other metrics, we think its important to track how fast earnings per share is growing, if at all. If you've also come to that realization, you're in luck, because today you can view this interactive graph of ICON's earnings per share history for free.
At the end of the day, it's often better to focus on companies that are free from net debt. You can access our special list of such companies (all with a track record of profit growth). It's free.
Have feedback on this article? Concerned about the content? Get in touch with us directly. Alternatively, email editorial-team (at) simplywallst.com.
This article by Simply Wall St is general in nature. We provide commentary based on historical data and analyst forecasts only using an unbiased methodology and our articles are not intended to be financial advice. It does not constitute a recommendation to buy or sell any stock, and does not take account of your objectives, or your financial situation. We aim to bring you long-term focused analysis driven by fundamental data. Note that our analysis may not factor in the latest price-sensitive company announcements or qualitative material. Simply Wall St has no position in any stocks mentioned.