
Full Truck Alliance's (NYSE:YMM) stock is up by a considerable 14% over the past three months. We wonder if and what role the company's financials play in that price change as a company's long-term fundamentals usually dictate market outcomes. Specifically, we decided to study Full Truck Alliance's ROE in this article.
ROE or return on equity is a useful tool to assess how effectively a company can generate returns on the investment it received from its shareholders. In other words, it is a profitability ratio which measures the rate of return on the capital provided by the company's shareholders.
How Is ROE Calculated?
The formula for ROE is:
Return on Equity = Net Profit (from continuing operations) ÷ Shareholders' Equity
So, based on the above formula, the ROE for Full Truck Alliance is:
6.8% = CN¥2.4b ÷ CN¥35b (Based on the trailing twelve months to March 2024).
The 'return' is the income the business earned over the last year. One way to conceptualize this is that for each $1 of shareholders' capital it has, the company made $0.07 in profit.
What Is The Relationship Between ROE And Earnings Growth?
We have already established that ROE serves as an efficient profit-generating gauge for a company's future earnings. We now need to evaluate how much profit the company reinvests or "retains" for future growth which then gives us an idea about the growth potential of the company. Assuming everything else remains unchanged, the higher the ROE and profit retention, the higher the growth rate of a company compared to companies that don't necessarily bear these characteristics.
Full Truck Alliance's Earnings Growth And 6.8% ROE
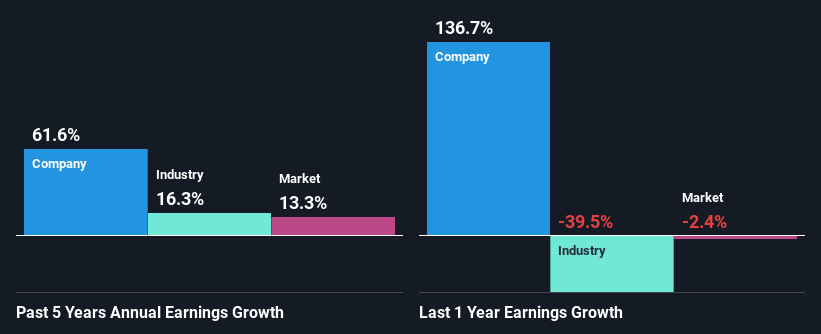
At first glance, Full Truck Alliance's ROE doesn't look very promising. A quick further study shows that the company's ROE doesn't compare favorably to the industry average of 11% either. Despite this, surprisingly, Full Truck Alliance saw an exceptional 62% net income growth over the past five years. Therefore, there could be other reasons behind this growth. For instance, the company has a low payout ratio or is being managed efficiently.
We then compared Full Truck Alliance's net income growth with the industry and we're pleased to see that the company's growth figure is higher when compared with the industry which has a growth rate of 16% in the same 5-year period.
The basis for attaching value to a company is, to a great extent, tied to its earnings growth. The investor should try to establish if the expected growth or decline in earnings, whichever the case may be, is priced in. By doing so, they will have an idea if the stock is headed into clear blue waters or if swampy waters await. If you're wondering about Full Truck Alliance's's valuation, check out this gauge of its price-to-earnings ratio, as compared to its industry.
Is Full Truck Alliance Making Efficient Use Of Its Profits?
Full Truck Alliance has a three-year median payout ratio of 47% (where it is retaining 53% of its income) which is not too low or not too high. By the looks of it, the dividend is well covered and Full Truck Alliance is reinvesting its profits efficiently as evidenced by its exceptional growth which we discussed above.
Our latest analyst data shows that the future payout ratio of the company is expected to drop to 25% over the next three years. Accordingly, the expected drop in the payout ratio explains the expected increase in the company's ROE to 11%, over the same period.
Conclusion
In total, it does look like Full Truck Alliance has some positive aspects to its business. With a high rate of reinvestment, albeit at a low ROE, the company has managed to see a considerable growth in its earnings. That being so, a study of the latest analyst forecasts show that the company is expected to see a slowdown in its future earnings growth. To know more about the latest analysts predictions for the company, check out this visualization of analyst forecasts for the company.
Have feedback on this article? Concerned about the content? Get in touch with us directly. Alternatively, email editorial-team (at) simplywallst.com.
This article by Simply Wall St is general in nature. We provide commentary based on historical data and analyst forecasts only using an unbiased methodology and our articles are not intended to be financial advice. It does not constitute a recommendation to buy or sell any stock, and does not take account of your objectives, or your financial situation. We aim to bring you long-term focused analysis driven by fundamental data. Note that our analysis may not factor in the latest price-sensitive company announcements or qualitative material. Simply Wall St has no position in any stocks mentioned.