
While Lamb Weston Holdings, Inc. (NYSE:LW) shareholders are probably generally happy, the stock hasn't had particularly good run recently, with the share price falling 17% in the last quarter. But at least the stock is up over the last five years. Unfortunately its return of 45% is below the market return of 95%. While the long term returns are impressive, we do have some sympathy for those who bought more recently, given the 26% drop, in the last year.
With that in mind, it's worth seeing if the company's underlying fundamentals have been the driver of long term performance, or if there are some discrepancies.
While the efficient markets hypothesis continues to be taught by some, it has been proven that markets are over-reactive dynamic systems, and investors are not always rational. One way to examine how market sentiment has changed over time is to look at the interaction between a company's share price and its earnings per share (EPS).
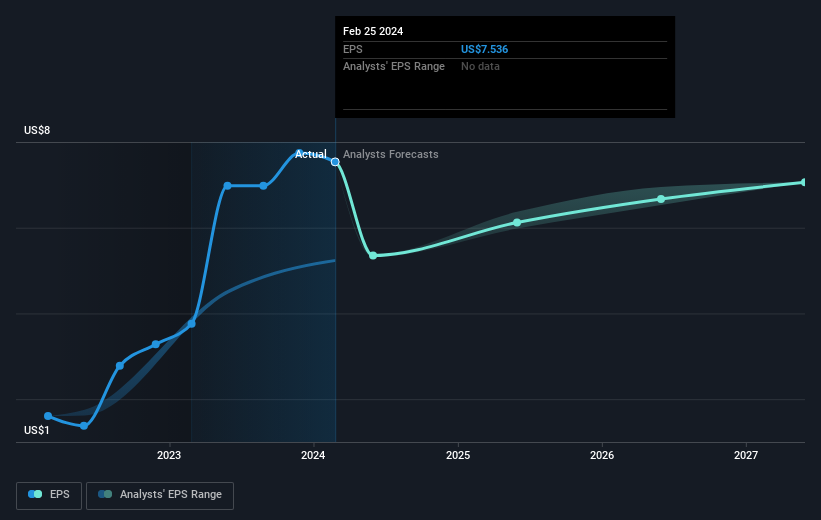
Over half a decade, Lamb Weston Holdings managed to grow its earnings per share at 19% a year. This EPS growth is higher than the 8% average annual increase in the share price. So it seems the market isn't so enthusiastic about the stock these days. The reasonably low P/E ratio of 11.28 also suggests market apprehension.
The company's earnings per share (over time) is depicted in the image below (click to see the exact numbers).
We like that insiders have been buying shares in the last twelve months. Having said that, most people consider earnings and revenue growth trends to be a more meaningful guide to the business. Before buying or selling a stock, we always recommend a close examination of historic growth trends, available here..
What About Dividends?
As well as measuring the share price return, investors should also consider the total shareholder return (TSR). Whereas the share price return only reflects the change in the share price, the TSR includes the value of dividends (assuming they were reinvested) and the benefit of any discounted capital raising or spin-off. Arguably, the TSR gives a more comprehensive picture of the return generated by a stock. As it happens, Lamb Weston Holdings' TSR for the last 5 years was 55%, which exceeds the share price return mentioned earlier. And there's no prize for guessing that the dividend payments largely explain the divergence!
A Different Perspective
Lamb Weston Holdings shareholders are down 25% for the year (even including dividends), but the market itself is up 23%. Even the share prices of good stocks drop sometimes, but we want to see improvements in the fundamental metrics of a business, before getting too interested. On the bright side, long term shareholders have made money, with a gain of 9% per year over half a decade. If the fundamental data continues to indicate long term sustainable growth, the current sell-off could be an opportunity worth considering. I find it very interesting to look at share price over the long term as a proxy for business performance. But to truly gain insight, we need to consider other information, too. To that end, you should learn about the 3 warning signs we've spotted with Lamb Weston Holdings (including 1 which is potentially serious) .
Lamb Weston Holdings is not the only stock insiders are buying. So take a peek at this free list of small cap companies at attractive valuations which insiders have been buying.
Please note, the market returns quoted in this article reflect the market weighted average returns of stocks that currently trade on American exchanges.
Have feedback on this article? Concerned about the content? Get in touch with us directly. Alternatively, email editorial-team (at) simplywallst.com.
This article by Simply Wall St is general in nature. We provide commentary based on historical data and analyst forecasts only using an unbiased methodology and our articles are not intended to be financial advice. It does not constitute a recommendation to buy or sell any stock, and does not take account of your objectives, or your financial situation. We aim to bring you long-term focused analysis driven by fundamental data. Note that our analysis may not factor in the latest price-sensitive company announcements or qualitative material. Simply Wall St has no position in any stocks mentioned.