
It hasn't been the best quarter for International Business Machines Corporation (NYSE:IBM) shareholders, since the share price has fallen 14% in that time. On the bright side the share price is up over the last half decade. Unfortunately its return of 26% is below the market return of 97%.
Now it's worth having a look at the company's fundamentals too, because that will help us determine if the long term shareholder return has matched the performance of the underlying business.
To quote Buffett, 'Ships will sail around the world but the Flat Earth Society will flourish. There will continue to be wide discrepancies between price and value in the marketplace...' One imperfect but simple way to consider how the market perception of a company has shifted is to compare the change in the earnings per share (EPS) with the share price movement.
 During five years of share price growth, International Business Machines actually saw its EPS drop 1.5% per year.
Since EPS is down a bit, and the share price is up, it's probably that the market previously had some concerns about the company, but the reality has been better than feared. In the long term, though, it will be hard for the share price rises to continue without improving EPS.
You can see below how EPS has changed over time (discover the exact values by clicking on the image).
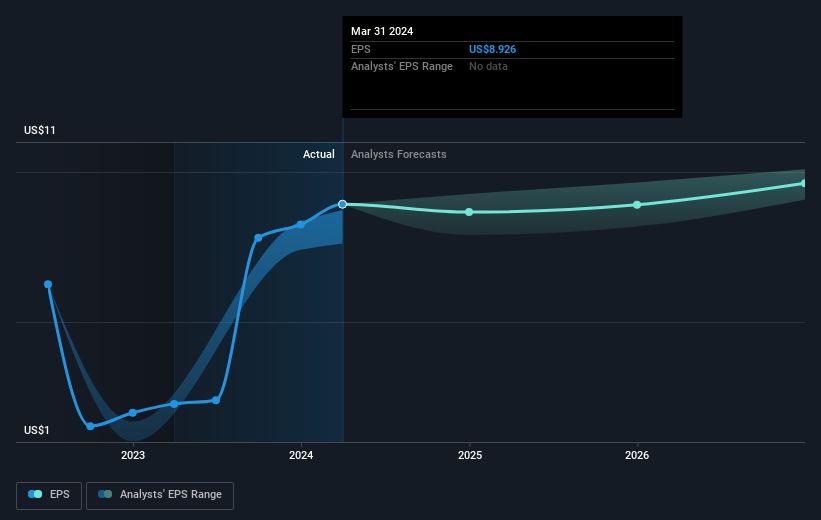
We know that International Business Machines has improved its bottom line over the last three years, but what does the future have in store? If you are thinking of buying or selling International Business Machines stock, you should check out this FREE detailed report on its balance sheet.
What About Dividends?
It is important to consider the total shareholder return, as well as the share price return, for any given stock. The TSR incorporates the value of any spin-offs or discounted capital raisings, along with any dividends, based on the assumption that the dividends are reinvested. It's fair to say that the TSR gives a more complete picture for stocks that pay a dividend. In the case of International Business Machines, it has a TSR of 68% for the last 5 years. That exceeds its share price return that we previously mentioned. And there's no prize for guessing that the dividend payments largely explain the divergence!
A Different Perspective
We're pleased to report that International Business Machines shareholders have received a total shareholder return of 30% over one year. That's including the dividend. That's better than the annualised return of 11% over half a decade, implying that the company is doing better recently. Someone with an optimistic perspective could view the recent improvement in TSR as indicating that the business itself is getting better with time. While it is well worth considering the different impacts that market conditions can have on the share price, there are other factors that are even more important. Case in point: We've spotted 1 warning sign for International Business Machines you should be aware of.
If you like to buy stocks alongside management, then you might just love this free list of companies. (Hint: many of them are unnoticed AND have attractive valuation).
Please note, the market returns quoted in this article reflect the market weighted average returns of stocks that currently trade on American exchanges.
Have feedback on this article? Concerned about the content? Get in touch with us directly. Alternatively, email editorial-team (at) simplywallst.com.
This article by Simply Wall St is general in nature. We provide commentary based on historical data and analyst forecasts only using an unbiased methodology and our articles are not intended to be financial advice. It does not constitute a recommendation to buy or sell any stock, and does not take account of your objectives, or your financial situation. We aim to bring you long-term focused analysis driven by fundamental data. Note that our analysis may not factor in the latest price-sensitive company announcements or qualitative material. Simply Wall St has no position in any stocks mentioned.