
If you buy and hold a stock for many years, you'd hope to be making a profit. Better yet, you'd like to see the share price move up more than the market average. Unfortunately for shareholders, while the Spectrum Brands Holdings, Inc. (NYSE:SPB) share price is up 56% in the last five years, that's less than the market return. Some buyers are laughing, though, with an increase of 21% in the last year.
Now it's worth having a look at the company's fundamentals too, because that will help us determine if the long term shareholder return has matched the performance of the underlying business.
While the efficient markets hypothesis continues to be taught by some, it has been proven that markets are over-reactive dynamic systems, and investors are not always rational. One way to examine how market sentiment has changed over time is to look at the interaction between a company's share price and its earnings per share (EPS).
Spectrum Brands Holdings has made a profit in the past. However, it made a loss in the last twelve months, suggesting profit may be an unreliable metric at this stage. So we might find other metrics can better explain the share price movements.
The modest 1.9% dividend yield is unlikely to be propping up the share price. It is not great to see that revenue has dropped by 3.6% per year over five years. So it seems one might have to take closer look at earnings and revenue trends to see how they might influence the share price.
The graphic below depicts how earnings and revenue have changed over time (unveil the exact values by clicking on the image).
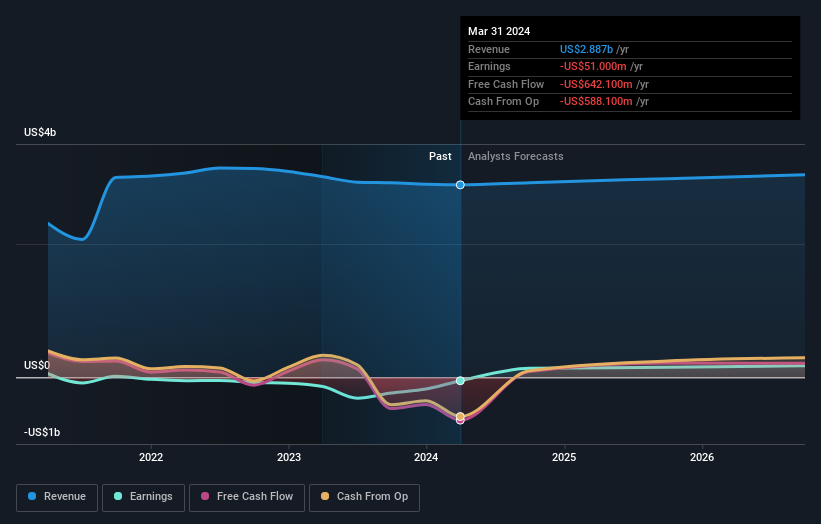
We consider it positive that insiders have made significant purchases in the last year. Having said that, most people consider earnings and revenue growth trends to be a more meaningful guide to the business. You can see what analysts are predicting for Spectrum Brands Holdings in this interactive graph of future profit estimates.
What About Dividends?
As well as measuring the share price return, investors should also consider the total shareholder return (TSR). Whereas the share price return only reflects the change in the share price, the TSR includes the value of dividends (assuming they were reinvested) and the benefit of any discounted capital raising or spin-off. So for companies that pay a generous dividend, the TSR is often a lot higher than the share price return. We note that for Spectrum Brands Holdings the TSR over the last 5 years was 77%, which is better than the share price return mentioned above. The dividends paid by the company have thusly boosted the total shareholder return.
A Different Perspective
Spectrum Brands Holdings provided a TSR of 24% over the year (including dividends). That's fairly close to the broader market return. Most would be happy with a gain, and it helps that the year's return is actually better than the average return over five years, which was 12%. It is possible that management foresight will bring growth well into the future, even if the share price slows down. It's always interesting to track share price performance over the longer term. But to understand Spectrum Brands Holdings better, we need to consider many other factors. Even so, be aware that Spectrum Brands Holdings is showing 1 warning sign in our investment analysis , you should know about...
There are plenty of other companies that have insiders buying up shares. You probably do not want to miss this free list of undervalued small cap companies that insiders are buying.
Please note, the market returns quoted in this article reflect the market weighted average returns of stocks that currently trade on American exchanges.
Have feedback on this article? Concerned about the content? Get in touch with us directly. Alternatively, email editorial-team (at) simplywallst.com.
This article by Simply Wall St is general in nature. We provide commentary based on historical data and analyst forecasts only using an unbiased methodology and our articles are not intended to be financial advice. It does not constitute a recommendation to buy or sell any stock, and does not take account of your objectives, or your financial situation. We aim to bring you long-term focused analysis driven by fundamental data. Note that our analysis may not factor in the latest price-sensitive company announcements or qualitative material. Simply Wall St has no position in any stocks mentioned.