
St. Joe (NYSE:JOE) has had a rough month with its share price down 6.0%. However, stock prices are usually driven by a company's financial performance over the long term, which in this case looks quite promising. Specifically, we decided to study St. Joe's ROE in this article.
ROE or return on equity is a useful tool to assess how effectively a company can generate returns on the investment it received from its shareholders. In short, ROE shows the profit each dollar generates with respect to its shareholder investments.
How To Calculate Return On Equity?
The formula for ROE is:
Return on Equity = Net Profit (from continuing operations) ÷ Shareholders' Equity
So, based on the above formula, the ROE for St. Joe is:
11% = US$78m ÷ US$705m (Based on the trailing twelve months to March 2024).
The 'return' is the amount earned after tax over the last twelve months. That means that for every $1 worth of shareholders' equity, the company generated $0.11 in profit.
Why Is ROE Important For Earnings Growth?
We have already established that ROE serves as an efficient profit-generating gauge for a company's future earnings. Based on how much of its profits the company chooses to reinvest or "retain", we are then able to evaluate a company's future ability to generate profits. Assuming everything else remains unchanged, the higher the ROE and profit retention, the higher the growth rate of a company compared to companies that don't necessarily bear these characteristics.
St. Joe's Earnings Growth And 11% ROE
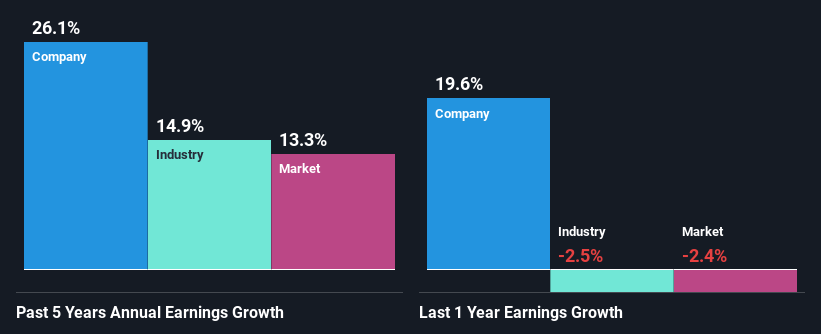
To start with, St. Joe's ROE looks acceptable. Especially when compared to the industry average of 4.7% the company's ROE looks pretty impressive. This probably laid the ground for St. Joe's significant 26% net income growth seen over the past five years. We reckon that there could also be other factors at play here. Such as - high earnings retention or an efficient management in place.
We then compared St. Joe's net income growth with the industry and we're pleased to see that the company's growth figure is higher when compared with the industry which has a growth rate of 15% in the same 5-year period.
The basis for attaching value to a company is, to a great extent, tied to its earnings growth. The investor should try to establish if the expected growth or decline in earnings, whichever the case may be, is priced in. This then helps them determine if the stock is placed for a bright or bleak future. One good indicator of expected earnings growth is the P/E ratio which determines the price the market is willing to pay for a stock based on its earnings prospects. So, you may want to check if St. Joe is trading on a high P/E or a low P/E, relative to its industry.
Is St. Joe Using Its Retained Earnings Effectively?
The three-year median payout ratio for St. Joe is 27%, which is moderately low. The company is retaining the remaining 73%. By the looks of it, the dividend is well covered and St. Joe is reinvesting its profits efficiently as evidenced by its exceptional growth which we discussed above.
Additionally, St. Joe has paid dividends over a period of three years which means that the company is pretty serious about sharing its profits with shareholders.
Conclusion
On the whole, we feel that St. Joe's performance has been quite good. Particularly, we like that the company is reinvesting heavily into its business, and at a high rate of return. Unsurprisingly, this has led to an impressive earnings growth. If the company continues to grow its earnings the way it has, that could have a positive impact on its share price given how earnings per share influence long-term share prices. Not to forget, share price outcomes are also dependent on the potential risks a company may face. So it is important for investors to be aware of the risks involved in the business. You can see the 1 risk we have identified for St. Joe by visiting our risks dashboard for free on our platform here.
Have feedback on this article? Concerned about the content? Get in touch with us directly. Alternatively, email editorial-team (at) simplywallst.com.
This article by Simply Wall St is general in nature. We provide commentary based on historical data and analyst forecasts only using an unbiased methodology and our articles are not intended to be financial advice. It does not constitute a recommendation to buy or sell any stock, and does not take account of your objectives, or your financial situation. We aim to bring you long-term focused analysis driven by fundamental data. Note that our analysis may not factor in the latest price-sensitive company announcements or qualitative material. Simply Wall St has no position in any stocks mentioned.