
Newly increased employment exceeds expectations, but the unemployment rate has risen to a two-year high. Of the 272,000 new jobs added in May, more than half may be inflated.
In May's non-farm report, there was one of the most bizarre scenes in recent years.
Official Friday data showed that the US added an unexpected 272,000 jobs in May, 50% higher than the consensus expected 180,000 and 14,000 higher than Wall Street's highest expectation. More surprisingly, this number was 4 standard deviations higher than the estimated value, setting a new record for the highest level in the past year. Hourly data also grew unexpectedly, higher than expected on a month-on-month and year-on-year basis.
However, at the same time, the unemployment rate unexpectedly rose from 3.9% to 4.0%, the highest level in two years.
Why did the unemployment rate rise despite the far exceeding expected increase in new job additions?
As previously mentioned by Wall Street news, this is related to the huge difference between the survey of companies and households, with the former surging by 272,000 and the latter significantly dropping by 408,000!
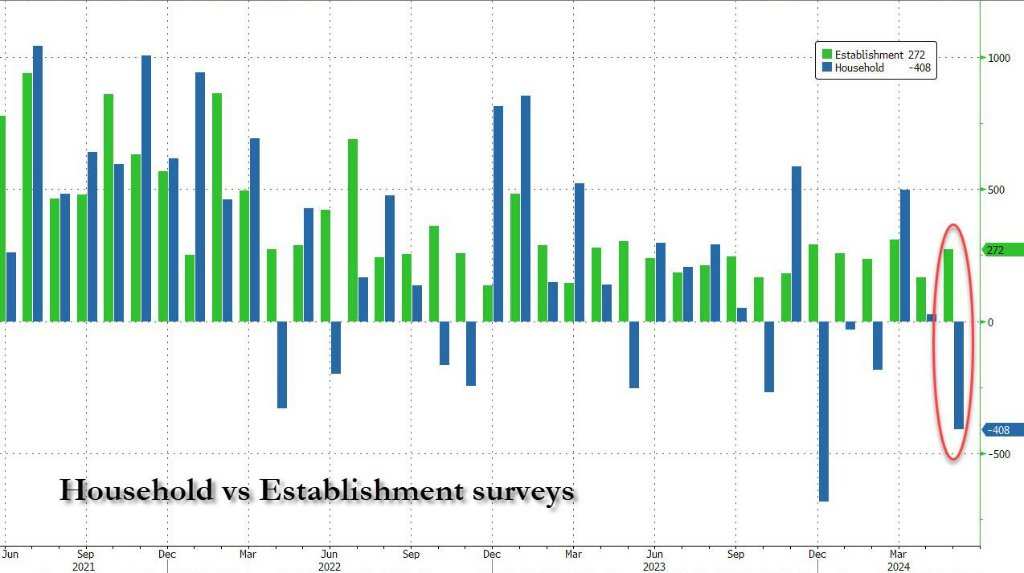
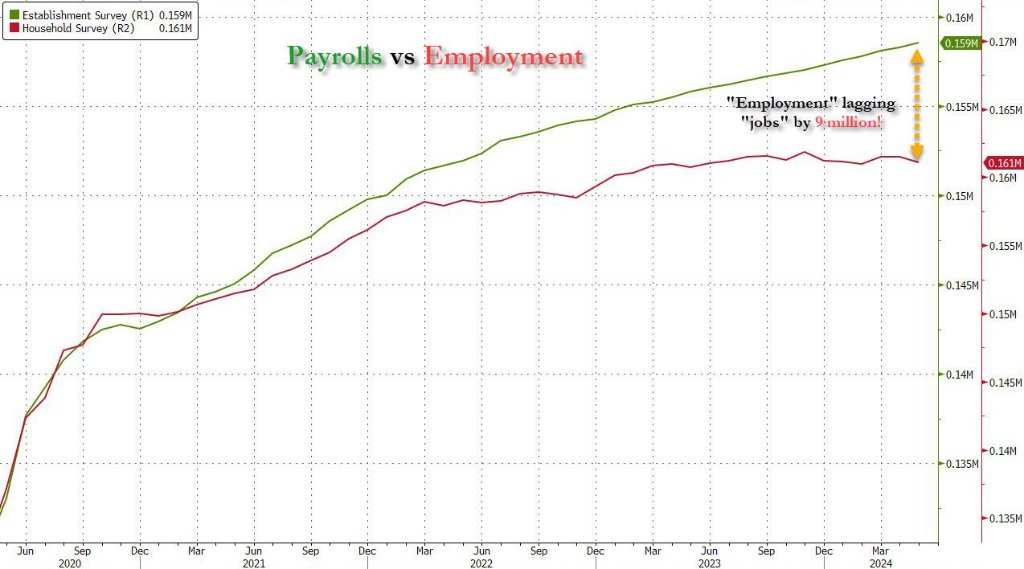
The survey of enterprises and the survey of households are the two main surveys used in the US to measure the employment market. Over the past year, the data from the survey of enterprises has been on an upward trend, while the data from the survey of households has been stagnant and has now fallen back to the level of last summer.
The difference between these two surveys has now reached 9 million, the largest gap ever recorded.
The surface added 272,000, but the actual number may be less than 100,000.
So here's the question, how much of the 272,000 new job additions this time are due to statistical adjustment?
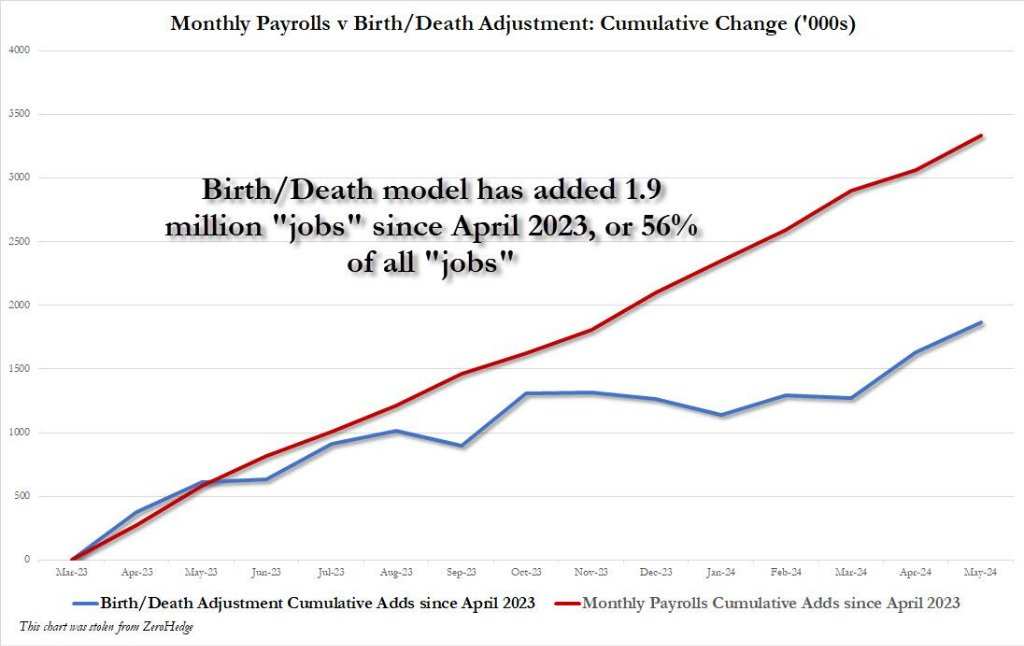
According to data from the US Bureau of Labor Statistics, 231,000 of all employment positions come from the "Birth/Death adjustment" model, which estimates the number of new businesses. These job positions are not actually counted, but are assumed to exist and are directly calculated into electronic spreadsheets.
In other words, these 231,000 jobs are only created out of thin air based on the assumption of the adjustment model, and are used to adjust the total number of jobs.
Well-known analyst Anna Wong pointed out that the Birth/Death adjustment model has fallen behind the real situation, and the actual speed of employment growth may be less than 100,000 per month. She believes that the unemployment rate data currently more accurately reflects the real situation in the employment market.
Since April last year, the Birth-Death model has added 1.9 million employment positions, accounting for 56% of all new employment additions during the same period.
Are half of the new jobs added by illegal immigrants?
On the surface, the new employment growth over the past year is absolutely impressive, demonstrating the strong momentum of the employment market. However, a deeper analysis of its structure reveals that the quality of new positions added is worrying.
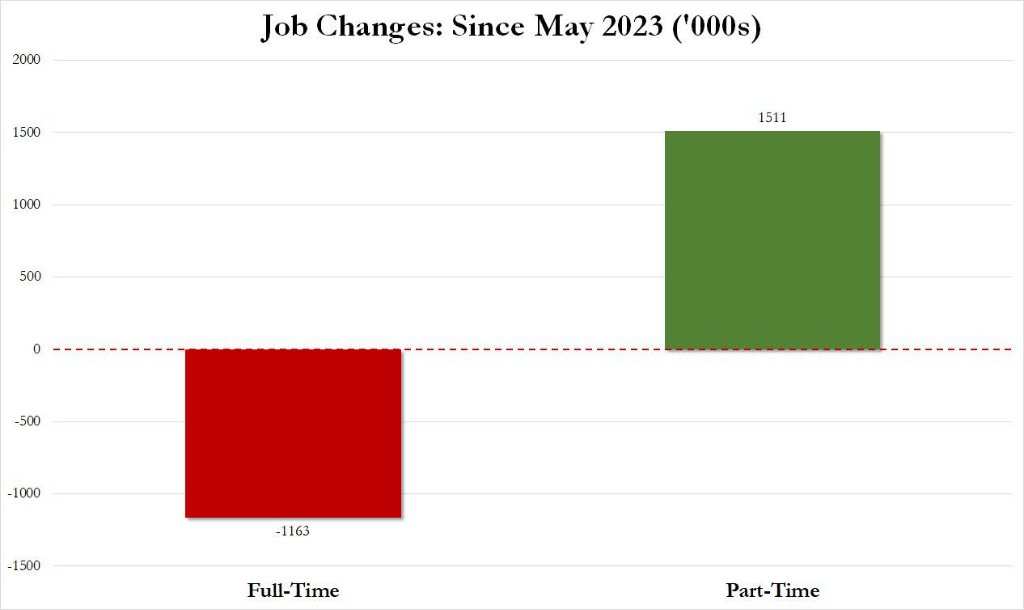
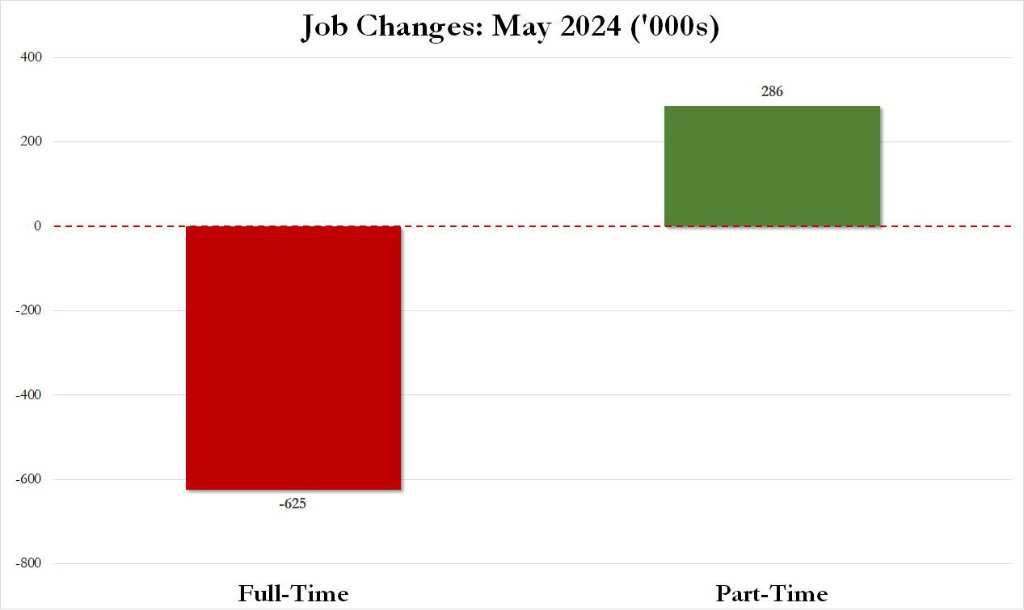
Over the past year, the number of full-time jobs in the United States has decreased by 1.2 million year-on-year, replaced by 1.5 million part-time positions.
In just one month in May alone, 625,000 full-time jobs disappeared, and part-time positions increased by 286,000.
Another figure worth noting is that in May, the number of local laborers in the United States decreased by 663,000 and the total number fell to 130.445 million, while the number of immigrants increased rapidly by 414,000.
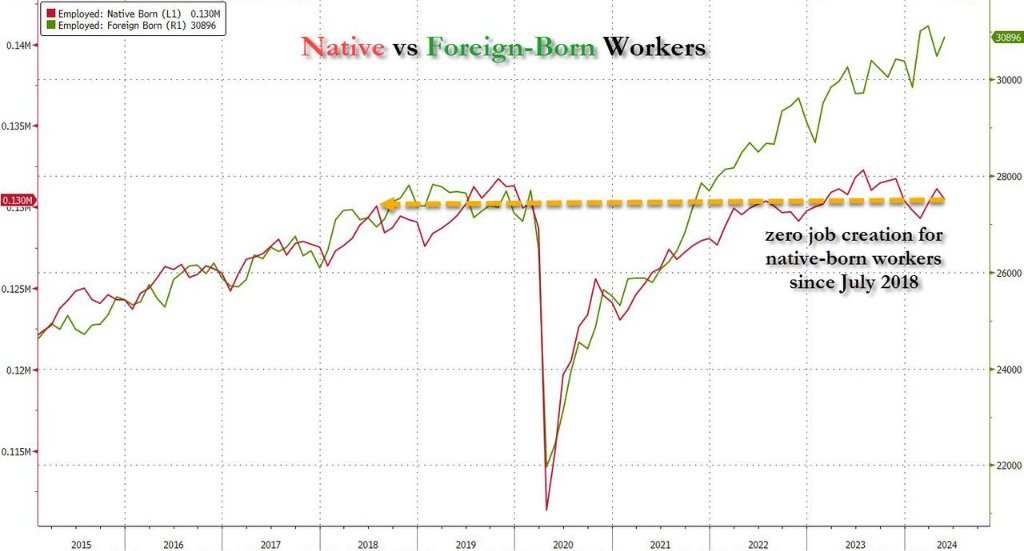
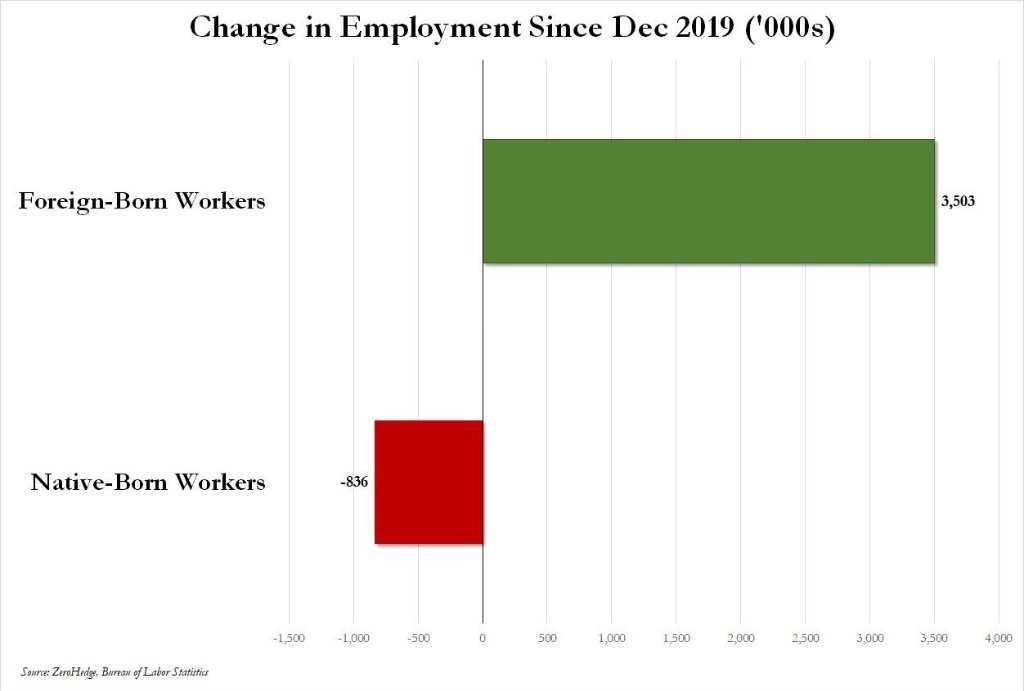
Going back four years, all new employment positions have been filled by immigrants, while employment positions for local workers have been decreasing since December 2019.
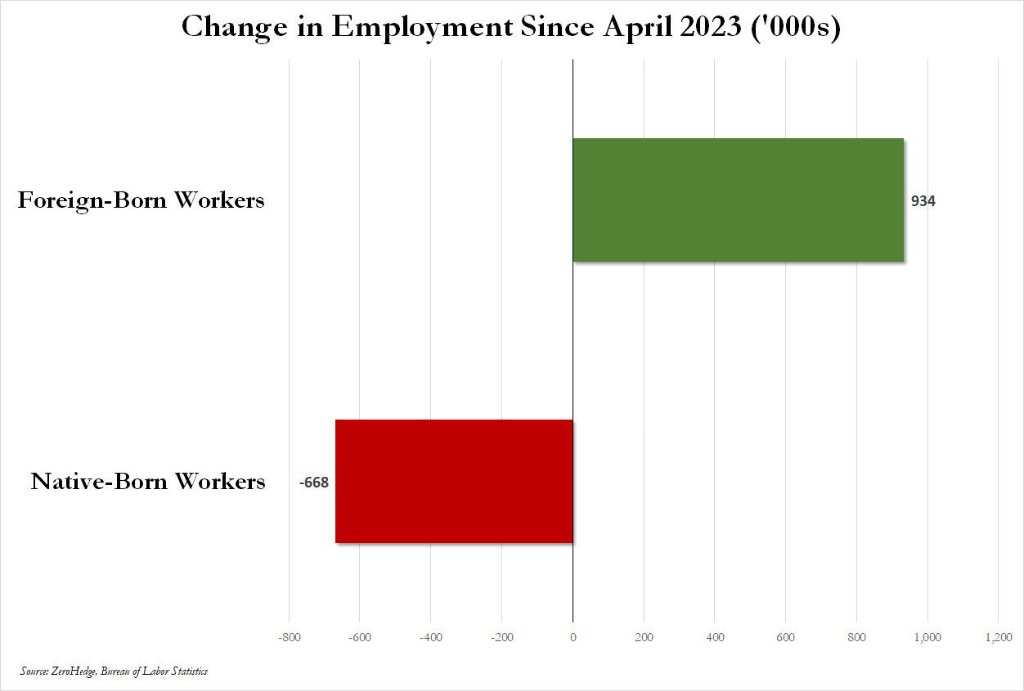
The situation over the past year is even worse: local workers have lost 668,000 positions, while immigrants have gained 934,000 positions.
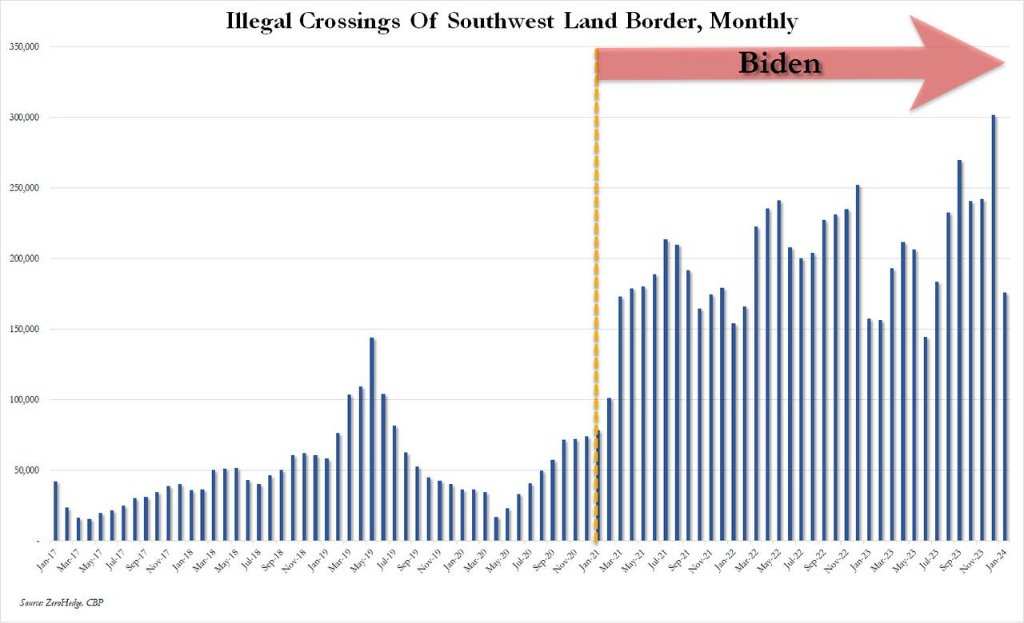
New immigrant jobs are likely to come from illegal immigrants. In the past three years, a large number of illegal immigrants have flooded into the US border.
In other words, employment growth in the United States is mainly driven by illegal immigrants, while the domestic labor market is constantly shrinking.
Before the non-farm report was released, Standard Chartered Bank released a report stating that if these illegal immigrant workers were excluded, non-farm employment may increase by around 125,000 per month in the 24 fiscal year, and the US employment market would not be as strong as it looks today. If the Federal Reserve fully understands the impact of illegal immigration on non-farm employment, then there is nothing to worry about with a non-farm growth rate of 231,000 per month.
Moreover, since the wages of these illegal immigrants are usually below the minimum wage standard, although millions of illegal immigrants have been employed in the past year, US inflation has not soared.
Editor/Emily