
With its stock down 15% over the past three months, it is easy to disregard Kadant (NYSE:KAI). But if you pay close attention, you might gather that its strong financials could mean that the stock could potentially see an increase in value in the long-term, given how markets usually reward companies with good financial health. In this article, we decided to focus on Kadant's ROE.
Return on equity or ROE is a key measure used to assess how efficiently a company's management is utilizing the company's capital. In other words, it is a profitability ratio which measures the rate of return on the capital provided by the company's shareholders.
How Do You Calculate Return On Equity?
The formula for return on equity is:
Return on Equity = Net Profit (from continuing operations) ÷ Shareholders' Equity
So, based on the above formula, the ROE for Kadant is:
14% = US$114m ÷ US$795m (Based on the trailing twelve months to March 2024).
The 'return' is the amount earned after tax over the last twelve months. That means that for every $1 worth of shareholders' equity, the company generated $0.14 in profit.
What Has ROE Got To Do With Earnings Growth?
We have already established that ROE serves as an efficient profit-generating gauge for a company's future earnings. We now need to evaluate how much profit the company reinvests or "retains" for future growth which then gives us an idea about the growth potential of the company. Assuming all else is equal, companies that have both a higher return on equity and higher profit retention are usually the ones that have a higher growth rate when compared to companies that don't have the same features.
Kadant's Earnings Growth And 14% ROE
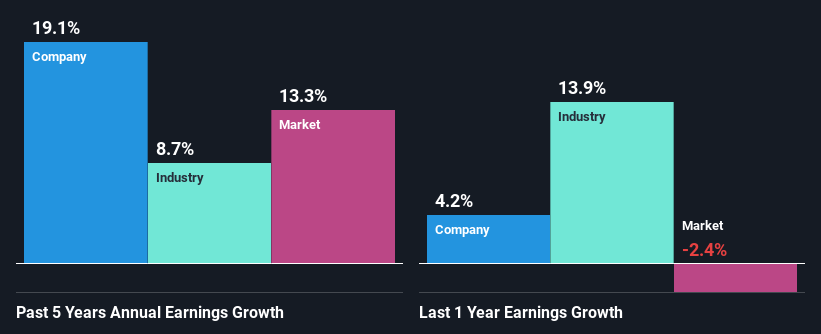
To start with, Kadant's ROE looks acceptable. Further, the company's ROE is similar to the industry average of 14%. This probably goes some way in explaining Kadant's moderate 19% growth over the past five years amongst other factors.
Next, on comparing with the industry net income growth, we found that Kadant's growth is quite high when compared to the industry average growth of 8.7% in the same period, which is great to see.
The basis for attaching value to a company is, to a great extent, tied to its earnings growth. It's important for an investor to know whether the market has priced in the company's expected earnings growth (or decline). By doing so, they will have an idea if the stock is headed into clear blue waters or if swampy waters await. Has the market priced in the future outlook for KAI? You can find out in our latest intrinsic value infographic research report.
Is Kadant Using Its Retained Earnings Effectively?
In Kadant's case, its respectable earnings growth can probably be explained by its low three-year median payout ratio of 12% (or a retention ratio of 88%), which suggests that the company is investing most of its profits to grow its business.
Besides, Kadant has been paying dividends for at least ten years or more. This shows that the company is committed to sharing profits with its shareholders.
Summary
In total, we are pretty happy with Kadant's performance. Particularly, we like that the company is reinvesting heavily into its business, and at a high rate of return. Unsurprisingly, this has led to an impressive earnings growth. That being so, a study of the latest analyst forecasts show that the company is expected to see a slowdown in its future earnings growth. To know more about the latest analysts predictions for the company, check out this visualization of analyst forecasts for the company.
Have feedback on this article? Concerned about the content? Get in touch with us directly. Alternatively, email editorial-team (at) simplywallst.com.
This article by Simply Wall St is general in nature. We provide commentary based on historical data and analyst forecasts only using an unbiased methodology and our articles are not intended to be financial advice. It does not constitute a recommendation to buy or sell any stock, and does not take account of your objectives, or your financial situation. We aim to bring you long-term focused analysis driven by fundamental data. Note that our analysis may not factor in the latest price-sensitive company announcements or qualitative material. Simply Wall St has no position in any stocks mentioned.